Immigrants from Eritrea vs Immigrants from Eastern Africa Poverty

COMPARE

Immigrants from Eritrea
Race
Ancestry
AfghanAfricanAlaska NativeAlaskan AthabascanAlbanianAleutAlsatianAmericanApacheArabArapahoArgentineanArmenianAssyrian/Chaldean/SyriacAustralianAustrianBahamianBangladeshiBarbadianBasqueBelgianBelizeanBermudanBhutaneseBlackfeetBolivianBrazilianBritishBritish West IndianBulgarianBurmeseCajunCambodianCanadianCape VerdeanCarpatho RusynCelticCentral AmericanCentral American IndianCherokeeCheyenneChickasawChileanChineseChippewaChoctawColombianColvilleComancheCosta RicanCreeCreekCroatianCrowCubanCypriotCzechCzechoslovakianDanishDelawareDominicanDutchDutch West IndianEastern EuropeanEcuadorianEgyptianEnglishEstonianEthiopianEuropeanFijianFilipinoFinnishFrenchFrench American IndianFrench CanadianGermanGerman RussianGhanaianGreekGuamanian/ChamorroGuatemalanGuyaneseHaitianHmongHonduranHopiHoumaHungarianIcelanderIndian (Asian)IndonesianInupiatIranianIraqiIrishIroquoisIsraeliItalianJamaicanJapaneseJordanianKenyanKiowaKoreanLaotianLatvianLebaneseLiberianLithuanianLumbeeLuxembourgerMacedonianMalaysianMalteseMarshalleseMenomineeMexicanMexican American IndianMongolianMoroccanNative HawaiianNavajoNepaleseNew ZealanderNicaraguanNigerianNorthern EuropeanNorwegianOkinawanOsageOttawaPaiutePakistaniPalestinianPanamanianParaguayanPennsylvania GermanPeruvianPimaPolishPortuguesePotawatomiPuebloPuerto RicanPuget Sound SalishRomanianRussianSalvadoranSamoanScandinavianScotch-IrishScottishSeminoleSenegaleseSerbianShoshoneSierra LeoneanSiouxSlavicSlovakSloveneSomaliSouth AfricanSouth AmericanSouth American IndianSoviet UnionSpaniardSpanishSpanish AmericanSpanish American IndianSri LankanSubsaharan AfricanSudaneseSwedishSwissSyrianTaiwaneseThaiTlingit-HaidaTohono O'OdhamTonganTrinidadian and TobagonianTsimshianTurkishU.S. Virgin IslanderUgandanUkrainianUruguayanUteVenezuelanVietnameseWelshWest IndianYakamaYaquiYugoslavianYumanYup'ikZimbabwean
Immigration
NonimmigrantsImmigrantsAfghanistanAfricaAlbaniaArgentinaArmeniaAsiaAustraliaAustriaBahamasBangladeshBarbadosBelarusBelgiumBelizeBoliviaBosnia and HerzegovinaBrazilBulgariaBurma/MyanmarCabo VerdeCambodiaCameroonCanadaCaribbeanCentral AmericaChileChinaColombiaCongoCosta RicaCroatiaCubaCzechoslovakiaDenmarkDominicaDominican RepublicEastern AsiaEastern EuropeEcuadorEgyptEl SalvadorEnglandEritreaEthiopiaEuropeFijiFranceGermanyGhanaGreeceGrenadaGuatemalaGuyanaHaitiHondurasHong KongHungaryIndiaIndonesiaIranIraqIrelandIsraelItalyJamaicaJapanJordanKazakhstanKenyaKoreaKuwaitLaosLatin AmericaLatviaLebanonLiberiaLithuaniaMalaysiaMexicoMicronesiaMiddle AfricaMoldovaMoroccoNepalNetherlandsNicaraguaNigeriaNorth AmericaNorth MacedoniaNorthern AfricaNorthern EuropeNorwayOceaniaPakistanPanamaPeruPhilippinesPolandPortugalRomaniaRussiaSaudi ArabiaScotlandSenegalSerbiaSierra LeoneSingaporeSomaliaSouth AfricaSouth AmericaSouth Central AsiaSouth Eastern AsiaSouthern EuropeSpainSri LankaSt. Vincent and the GrenadinesSudanSwedenSwitzerlandSyriaTaiwanThailandTrinidad and TobagoTurkeyUgandaUkraineUruguayUzbekistanVenezuelaVietnamWest IndiesWestern AfricaWestern AsiaWestern EuropeYemenZaireZimbabweAzores
Immigrants from Eastern Africa
Race
Ancestry
AfghanAfricanAlaska NativeAlaskan AthabascanAlbanianAleutAlsatianAmericanApacheArabArapahoArgentineanArmenianAssyrian/Chaldean/SyriacAustralianAustrianBahamianBangladeshiBarbadianBasqueBelgianBelizeanBermudanBhutaneseBlackfeetBolivianBrazilianBritishBritish West IndianBulgarianBurmeseCajunCambodianCanadianCape VerdeanCarpatho RusynCelticCentral AmericanCentral American IndianCherokeeCheyenneChickasawChileanChineseChippewaChoctawColombianColvilleComancheCosta RicanCreeCreekCroatianCrowCubanCypriotCzechCzechoslovakianDanishDelawareDominicanDutchDutch West IndianEastern EuropeanEcuadorianEgyptianEnglishEstonianEthiopianEuropeanFijianFilipinoFinnishFrenchFrench American IndianFrench CanadianGermanGerman RussianGhanaianGreekGuamanian/ChamorroGuatemalanGuyaneseHaitianHmongHonduranHopiHoumaHungarianIcelanderIndian (Asian)IndonesianInupiatIranianIraqiIrishIroquoisIsraeliItalianJamaicanJapaneseJordanianKenyanKiowaKoreanLaotianLatvianLebaneseLiberianLithuanianLumbeeLuxembourgerMacedonianMalaysianMalteseMarshalleseMenomineeMexicanMexican American IndianMongolianMoroccanNative HawaiianNavajoNepaleseNew ZealanderNicaraguanNigerianNorthern EuropeanNorwegianOkinawanOsageOttawaPaiutePakistaniPalestinianPanamanianParaguayanPennsylvania GermanPeruvianPimaPolishPortuguesePotawatomiPuebloPuerto RicanPuget Sound SalishRomanianRussianSalvadoranSamoanScandinavianScotch-IrishScottishSeminoleSenegaleseSerbianShoshoneSierra LeoneanSiouxSlavicSlovakSloveneSomaliSouth AfricanSouth AmericanSouth American IndianSoviet UnionSpaniardSpanishSpanish AmericanSpanish American IndianSri LankanSubsaharan AfricanSudaneseSwedishSwissSyrianTaiwaneseThaiTlingit-HaidaTohono O'OdhamTonganTrinidadian and TobagonianTsimshianTurkishU.S. Virgin IslanderUgandanUkrainianUruguayanUteVenezuelanVietnameseWelshWest IndianYakamaYaquiYugoslavianYumanYup'ikZimbabwean
Immigration
NonimmigrantsImmigrantsAfghanistanAfricaAlbaniaArgentinaArmeniaAsiaAustraliaAustriaBahamasBangladeshBarbadosBelarusBelgiumBelizeBoliviaBosnia and HerzegovinaBrazilBulgariaBurma/MyanmarCabo VerdeCambodiaCameroonCanadaCaribbeanCentral AmericaChileChinaColombiaCongoCosta RicaCroatiaCubaCzechoslovakiaDenmarkDominicaDominican RepublicEastern AfricaEastern AsiaEastern EuropeEcuadorEgyptEl SalvadorEnglandEthiopiaEuropeFijiFranceGermanyGhanaGreeceGrenadaGuatemalaGuyanaHaitiHondurasHong KongHungaryIndiaIndonesiaIranIraqIrelandIsraelItalyJamaicaJapanJordanKazakhstanKenyaKoreaKuwaitLaosLatin AmericaLatviaLebanonLiberiaLithuaniaMalaysiaMexicoMicronesiaMiddle AfricaMoldovaMoroccoNepalNetherlandsNicaraguaNigeriaNorth AmericaNorth MacedoniaNorthern AfricaNorthern EuropeNorwayOceaniaPakistanPanamaPeruPhilippinesPolandPortugalRomaniaRussiaSaudi ArabiaScotlandSenegalSerbiaSierra LeoneSingaporeSomaliaSouth AfricaSouth AmericaSouth Central AsiaSouth Eastern AsiaSouthern EuropeSpainSri LankaSt. Vincent and the GrenadinesSudanSwedenSwitzerlandSyriaTaiwanThailandTrinidad and TobagoTurkeyUgandaUkraineUruguayUzbekistanVenezuelaVietnamWest IndiesWestern AfricaWestern AsiaWestern EuropeYemenZaireZimbabweAzores
Poverty
Income
Poverty
Unemployment
Labor Participation
Family Structure
Vehicle Availability
Education Level
Disability

Poverty Comparison

Immigrants from Eritrea

Immigrants from Eastern Africa

Tragic
Tragic
13.4%
POVERTY
2.4/ 100
METRIC RATING
224th/ 347
METRIC RANK
13.1%
POVERTY
7.0/ 100
METRIC RATING
206th/ 347
METRIC RANK

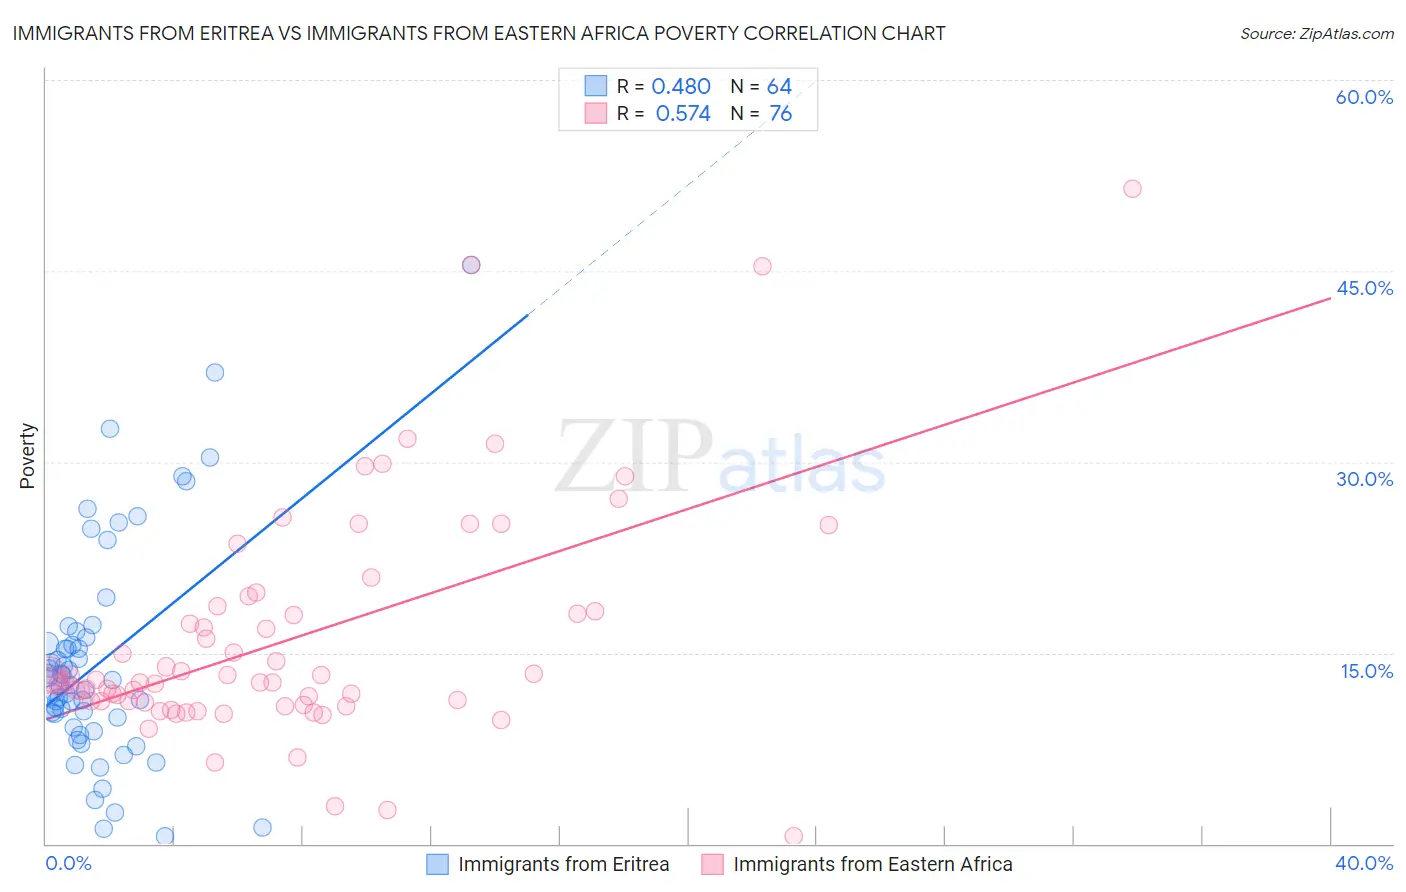
Immigrants from Eritrea vs Immigrants from Eastern Africa Poverty Correlation Chart

The statistical analysis conducted on geographies consisting of 104,846,826 people shows a moderate positive correlation between the proportion of Immigrants from Eritrea and poverty level in the United States with a correlation coefficient (R) of 0.480 and weighted average of 13.4%. Similarly, the statistical analysis conducted on geographies consisting of 354,926,881 people shows a substantial positive correlation between the proportion of Immigrants from Eastern Africa and poverty level in the United States with a correlation coefficient (R) of 0.574 and weighted average of 13.1%, a difference of 2.5%.
Immigrants from Eritrea vs Immigrants from Eastern Africa Poverty

Poverty Correlation Summary

MeasurementImmigrants from EritreaImmigrants from Eastern Africa
Minimum0.62%0.57%
Maximum45.5%51.5%
Range44.8%50.9%
Mean14.2%16.1%
Median12.6%12.8%
Interquartile 25% (IQ1)9.5%11.1%
Interquartile 75% (IQ3)16.0%18.5%
Interquartile Range (IQR)6.4%7.4%
Standard Deviation (Sample)8.6%9.2%
Standard Deviation (Population)8.5%9.1%

Demographics Similar to Immigrants from Eritrea and Immigrants from Eastern Africa by Poverty

In terms of poverty, the demographic groups most similar to Immigrants from Eritrea are Immigrants from Africa (13.4%, a difference of 0.10%), Immigrants from Micronesia (13.4%, a difference of 0.14%), Alsatian (13.4%, a difference of 0.18%), German Russian (13.4%, a difference of 0.22%), and American (13.4%, a difference of 0.38%). Similarly, the demographic groups most similar to Immigrants from Eastern Africa are Panamanian (13.1%, a difference of 0.12%), Ugandan (13.1%, a difference of 0.27%), Malaysian (13.1%, a difference of 0.30%), Immigrants from the Azores (13.1%, a difference of 0.34%), and Moroccan (13.2%, a difference of 0.69%).
DemographicsRating | RankPoverty
Tsimshian
9.2
/100
|
#205
Tragic
13.0%
Immigrants | Eastern Africa
7.0
/100
|
#206
Tragic
13.1%
Panamanians
6.6
/100
|
#207
Tragic
13.1%
Ugandans
6.2
/100
|
#208
Tragic
13.1%
Malaysians
6.1
/100
|
#209
Tragic
13.1%
Immigrants | Azores
6.1
/100
|
#210
Tragic
13.1%
Moroccans
5.2
/100
|
#211
Tragic
13.2%
Immigrants | Immigrants
4.3
/100
|
#212
Tragic
13.2%
Immigrants | Panama
4.1
/100
|
#213
Tragic
13.3%
Bermudans
3.7
/100
|
#214
Tragic
13.3%
Japanese
3.3
/100
|
#215
Tragic
13.3%
Immigrants | Nonimmigrants
3.3
/100
|
#216
Tragic
13.3%
Immigrants | Uzbekistan
3.2
/100
|
#217
Tragic
13.3%
Immigrants | Thailand
3.1
/100
|
#218
Tragic
13.3%
Immigrants | Cambodia
3.0
/100
|
#219
Tragic
13.4%
Americans
2.9
/100
|
#220
Tragic
13.4%
Alsatians
2.6
/100
|
#221
Tragic
13.4%
Immigrants | Micronesia
2.6
/100
|
#222
Tragic
13.4%
Immigrants | Africa
2.5
/100
|
#223
Tragic
13.4%
Immigrants | Eritrea
2.4
/100
|
#224
Tragic
13.4%
German Russians
2.2
/100
|
#225
Tragic
13.4%