Immigrants from England vs Immigrants from North Macedonia Child Poverty Under the Age of 16

COMPARE

Immigrants from England
Race
Ancestry
AfghanAfricanAlaska NativeAlaskan AthabascanAlbanianAleutAlsatianAmericanApacheArabArapahoArgentineanArmenianAssyrian/Chaldean/SyriacAustralianAustrianBahamianBangladeshiBarbadianBasqueBelgianBelizeanBermudanBhutaneseBlackfeetBolivianBrazilianBritishBritish West IndianBulgarianBurmeseCajunCambodianCanadianCape VerdeanCarpatho RusynCelticCentral AmericanCentral American IndianCherokeeCheyenneChickasawChileanChineseChippewaChoctawColombianColvilleComancheCosta RicanCreeCreekCroatianCrowCubanCypriotCzechCzechoslovakianDanishDelawareDominicanDutchDutch West IndianEastern EuropeanEcuadorianEgyptianEnglishEstonianEthiopianEuropeanFijianFilipinoFinnishFrenchFrench American IndianFrench CanadianGermanGerman RussianGhanaianGreekGuamanian/ChamorroGuatemalanGuyaneseHaitianHmongHonduranHopiHoumaHungarianIcelanderIndian (Asian)IndonesianInupiatIranianIraqiIrishIroquoisIsraeliItalianJamaicanJapaneseJordanianKenyanKiowaKoreanLaotianLatvianLebaneseLiberianLithuanianLumbeeLuxembourgerMacedonianMalaysianMalteseMarshalleseMenomineeMexicanMexican American IndianMongolianMoroccanNative HawaiianNavajoNepaleseNew ZealanderNicaraguanNigerianNorthern EuropeanNorwegianOkinawanOsageOttawaPaiutePakistaniPalestinianPanamanianParaguayanPennsylvania GermanPeruvianPimaPolishPortuguesePotawatomiPuebloPuerto RicanPuget Sound SalishRomanianRussianSalvadoranSamoanScandinavianScotch-IrishScottishSeminoleSenegaleseSerbianShoshoneSierra LeoneanSiouxSlavicSlovakSloveneSomaliSouth AfricanSouth AmericanSouth American IndianSoviet UnionSpaniardSpanishSpanish AmericanSpanish American IndianSri LankanSubsaharan AfricanSudaneseSwedishSwissSyrianTaiwaneseThaiTlingit-HaidaTohono O'OdhamTonganTrinidadian and TobagonianTsimshianTurkishU.S. Virgin IslanderUgandanUkrainianUruguayanUteVenezuelanVietnameseWelshWest IndianYakamaYaquiYugoslavianYumanYup'ikZimbabwean
Immigration
NonimmigrantsImmigrantsAfghanistanAfricaAlbaniaArgentinaArmeniaAsiaAustraliaAustriaBahamasBangladeshBarbadosBelarusBelgiumBelizeBoliviaBosnia and HerzegovinaBrazilBulgariaBurma/MyanmarCabo VerdeCambodiaCameroonCanadaCaribbeanCentral AmericaChileChinaColombiaCongoCosta RicaCroatiaCubaCzechoslovakiaDenmarkDominicaDominican RepublicEastern AfricaEastern AsiaEastern EuropeEcuadorEgyptEl SalvadorEnglandEritreaEthiopiaEuropeFijiFranceGermanyGhanaGreeceGrenadaGuatemalaGuyanaHaitiHondurasHong KongHungaryIndiaIndonesiaIranIraqIrelandIsraelItalyJamaicaJapanJordanKazakhstanKenyaKoreaKuwaitLaosLatin AmericaLatviaLebanonLiberiaLithuaniaMalaysiaMexicoMicronesiaMiddle AfricaMoldovaMoroccoNepalNetherlandsNicaraguaNigeriaNorth AmericaNorthern AfricaNorthern EuropeNorwayOceaniaPakistanPanamaPeruPhilippinesPolandPortugalRomaniaRussiaSaudi ArabiaScotlandSenegalSerbiaSierra LeoneSingaporeSomaliaSouth AfricaSouth AmericaSouth Central AsiaSouth Eastern AsiaSouthern EuropeSpainSri LankaSt. Vincent and the GrenadinesSudanSwedenSwitzerlandSyriaTaiwanThailandTrinidad and TobagoTurkeyUgandaUkraineUruguayUzbekistanVenezuelaVietnamWest IndiesWestern AfricaWestern AsiaWestern EuropeYemenZaireZimbabweAzores
Immigrants from North Macedonia
Race
Ancestry
AfghanAfricanAlaska NativeAlaskan AthabascanAlbanianAleutAlsatianAmericanApacheArabArapahoArgentineanArmenianAssyrian/Chaldean/SyriacAustralianAustrianBahamianBangladeshiBarbadianBasqueBelgianBelizeanBermudanBhutaneseBlackfeetBolivianBrazilianBritishBritish West IndianBulgarianBurmeseCajunCambodianCanadianCape VerdeanCarpatho RusynCelticCentral AmericanCentral American IndianCherokeeCheyenneChickasawChileanChineseChippewaChoctawColombianColvilleComancheCosta RicanCreeCreekCroatianCrowCubanCypriotCzechCzechoslovakianDanishDelawareDominicanDutchDutch West IndianEastern EuropeanEcuadorianEgyptianEnglishEstonianEthiopianEuropeanFijianFilipinoFinnishFrenchFrench American IndianFrench CanadianGermanGerman RussianGhanaianGreekGuamanian/ChamorroGuatemalanGuyaneseHaitianHmongHonduranHopiHoumaHungarianIcelanderIndian (Asian)IndonesianInupiatIranianIraqiIrishIroquoisIsraeliItalianJamaicanJapaneseJordanianKenyanKiowaKoreanLaotianLatvianLebaneseLiberianLithuanianLumbeeLuxembourgerMacedonianMalaysianMalteseMarshalleseMenomineeMexicanMexican American IndianMongolianMoroccanNative HawaiianNavajoNepaleseNew ZealanderNicaraguanNigerianNorthern EuropeanNorwegianOkinawanOsageOttawaPaiutePakistaniPalestinianPanamanianParaguayanPennsylvania GermanPeruvianPimaPolishPortuguesePotawatomiPuebloPuerto RicanPuget Sound SalishRomanianRussianSalvadoranSamoanScandinavianScotch-IrishScottishSeminoleSenegaleseSerbianShoshoneSierra LeoneanSiouxSlavicSlovakSloveneSomaliSouth AfricanSouth AmericanSouth American IndianSoviet UnionSpaniardSpanishSpanish AmericanSpanish American IndianSri LankanSubsaharan AfricanSudaneseSwedishSwissSyrianTaiwaneseThaiTlingit-HaidaTohono O'OdhamTonganTrinidadian and TobagonianTsimshianTurkishU.S. Virgin IslanderUgandanUkrainianUruguayanUteVenezuelanVietnameseWelshWest IndianYakamaYaquiYugoslavianYumanYup'ikZimbabwean
Immigration
NonimmigrantsImmigrantsAfghanistanAfricaAlbaniaArgentinaArmeniaAsiaAustraliaAustriaBahamasBangladeshBarbadosBelarusBelgiumBelizeBoliviaBosnia and HerzegovinaBrazilBulgariaBurma/MyanmarCabo VerdeCambodiaCameroonCanadaCaribbeanCentral AmericaChileChinaColombiaCongoCosta RicaCroatiaCubaCzechoslovakiaDenmarkDominicaDominican RepublicEastern AfricaEastern AsiaEastern EuropeEcuadorEgyptEl SalvadorEritreaEthiopiaEuropeFijiFranceGermanyGhanaGreeceGrenadaGuatemalaGuyanaHaitiHondurasHong KongHungaryIndiaIndonesiaIranIraqIrelandIsraelItalyJamaicaJapanJordanKazakhstanKenyaKoreaKuwaitLaosLatin AmericaLatviaLebanonLiberiaLithuaniaMalaysiaMexicoMicronesiaMiddle AfricaMoldovaMoroccoNepalNetherlandsNicaraguaNigeriaNorth AmericaNorth MacedoniaNorthern AfricaNorthern EuropeNorwayOceaniaPakistanPanamaPeruPhilippinesPolandPortugalRomaniaRussiaSaudi ArabiaScotlandSenegalSerbiaSierra LeoneSingaporeSomaliaSouth AfricaSouth AmericaSouth Central AsiaSouth Eastern AsiaSouthern EuropeSpainSri LankaSt. Vincent and the GrenadinesSudanSwedenSwitzerlandSyriaTaiwanThailandTrinidad and TobagoTurkeyUgandaUkraineUruguayUzbekistanVenezuelaVietnamWest IndiesWestern AfricaWestern AsiaWestern EuropeYemenZaireZimbabweAzores
Child Poverty Under the Age of 16
Income
Poverty
Unemployment
Labor Participation
Family Structure
Vehicle Availability
Education Level
Disability

Child Poverty Under the Age of 16 Comparison

Immigrants from England

Immigrants from North Macedonia

Exceptional
Exceptional
14.8%
CHILD POVERTY UNDER THE AGE OF 16
94.8/ 100
METRIC RATING
104th/ 347
METRIC RANK
14.5%
CHILD POVERTY UNDER THE AGE OF 16
97.2/ 100
METRIC RATING
80th/ 347
METRIC RANK

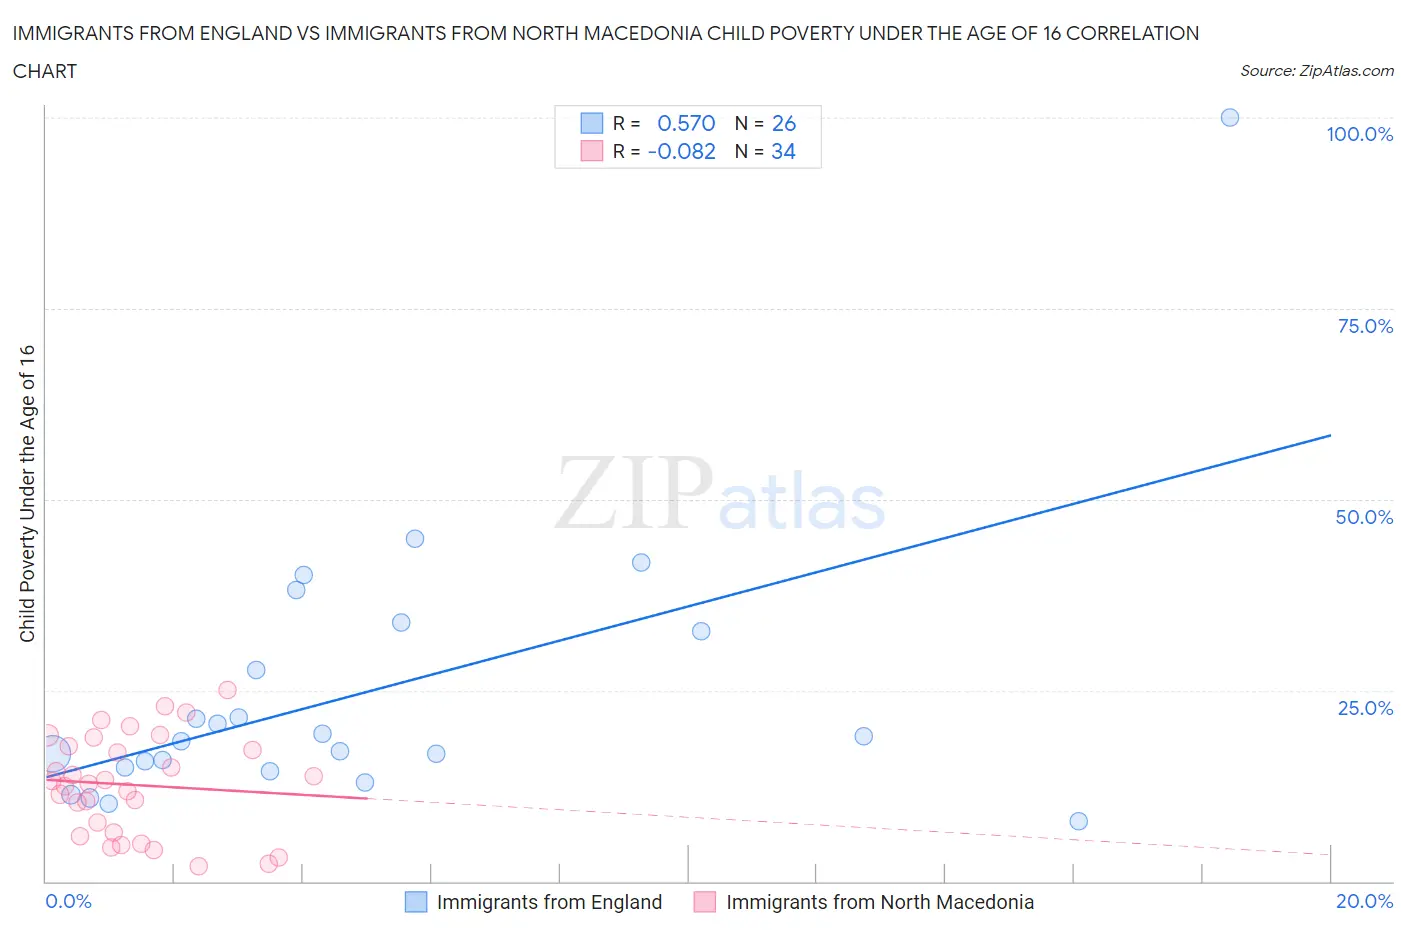
Immigrants from England vs Immigrants from North Macedonia Child Poverty Under the Age of 16 Correlation Chart

The statistical analysis conducted on geographies consisting of 387,672,551 people shows a substantial positive correlation between the proportion of Immigrants from England and poverty level among children under the age of 16 in the United States with a correlation coefficient (R) of 0.570 and weighted average of 14.8%. Similarly, the statistical analysis conducted on geographies consisting of 73,988,671 people shows a slight negative correlation between the proportion of Immigrants from North Macedonia and poverty level among children under the age of 16 in the United States with a correlation coefficient (R) of -0.082 and weighted average of 14.5%, a difference of 2.2%.
Immigrants from England vs Immigrants from North Macedonia Child Poverty Under the Age of 16

Child Poverty Under the Age of 16 Correlation Summary

MeasurementImmigrants from EnglandImmigrants from North Macedonia
Minimum7.8%2.0%
Maximum100.0%25.1%
Range92.2%23.1%
Mean24.7%12.6%
Median18.6%12.9%
Interquartile 25% (IQ1)14.9%6.4%
Interquartile 75% (IQ3)32.7%17.6%
Interquartile Range (IQR)17.8%11.2%
Standard Deviation (Sample)18.6%6.5%
Standard Deviation (Population)18.2%6.4%

Similar Demographics by Child Poverty Under the Age of 16

Demographics Similar to Immigrants from England by Child Poverty Under the Age of 16

In terms of child poverty under the age of 16, the demographic groups most similar to Immigrants from England are Immigrants from Egypt (14.8%, a difference of 0.040%), Romanian (14.8%, a difference of 0.090%), Basque (14.8%, a difference of 0.11%), Immigrants from Switzerland (14.8%, a difference of 0.16%), and Dutch (14.8%, a difference of 0.17%).
DemographicsRating | RankChild Poverty Under the Age of 16
Paraguayans
95.7
/100
|
#97
Exceptional
14.7%
Immigrants | Belarus
95.7
/100
|
#98
Exceptional
14.7%
British
95.5
/100
|
#99
Exceptional
14.7%
Dutch
95.1
/100
|
#100
Exceptional
14.8%
Immigrants | Switzerland
95.1
/100
|
#101
Exceptional
14.8%
Romanians
95.0
/100
|
#102
Exceptional
14.8%
Immigrants | Egypt
94.9
/100
|
#103
Exceptional
14.8%
Immigrants | England
94.8
/100
|
#104
Exceptional
14.8%
Basques
94.7
/100
|
#105
Exceptional
14.8%
Serbians
94.5
/100
|
#106
Exceptional
14.8%
Chileans
94.4
/100
|
#107
Exceptional
14.8%
Jordanians
94.2
/100
|
#108
Exceptional
14.8%
Tlingit-Haida
94.1
/100
|
#109
Exceptional
14.9%
English
93.5
/100
|
#110
Exceptional
14.9%
Immigrants | Denmark
93.5
/100
|
#111
Exceptional
14.9%

Demographics Similar to Immigrants from North Macedonia by Child Poverty Under the Age of 16

In terms of child poverty under the age of 16, the demographic groups most similar to Immigrants from North Macedonia are Finnish (14.5%, a difference of 0.030%), Immigrants from Canada (14.5%, a difference of 0.060%), Swiss (14.5%, a difference of 0.070%), Egyptian (14.5%, a difference of 0.090%), and Immigrants from Russia (14.5%, a difference of 0.10%).
DemographicsRating | RankChild Poverty Under the Age of 16
Immigrants | Turkey
97.6
/100
|
#73
Exceptional
14.4%
Macedonians
97.6
/100
|
#74
Exceptional
14.4%
Ukrainians
97.5
/100
|
#75
Exceptional
14.4%
Immigrants | Eastern Europe
97.5
/100
|
#76
Exceptional
14.4%
Australians
97.5
/100
|
#77
Exceptional
14.4%
Immigrants | Russia
97.3
/100
|
#78
Exceptional
14.5%
Swiss
97.3
/100
|
#79
Exceptional
14.5%
Immigrants | North Macedonia
97.2
/100
|
#80
Exceptional
14.5%
Finns
97.2
/100
|
#81
Exceptional
14.5%
Immigrants | Canada
97.2
/100
|
#82
Exceptional
14.5%
Egyptians
97.2
/100
|
#83
Exceptional
14.5%
Immigrants | Latvia
97.1
/100
|
#84
Exceptional
14.5%
Soviet Union
97.1
/100
|
#85
Exceptional
14.5%
Immigrants | Argentina
97.1
/100
|
#86
Exceptional
14.5%
Taiwanese
97.1
/100
|
#87
Exceptional
14.5%