Immigrants from England vs Immigrants from Egypt Child Poverty Under the Age of 5

COMPARE

Immigrants from England
Race
Ancestry
AfghanAfricanAlaska NativeAlaskan AthabascanAlbanianAleutAlsatianAmericanApacheArabArapahoArgentineanArmenianAssyrian/Chaldean/SyriacAustralianAustrianBahamianBangladeshiBarbadianBasqueBelgianBelizeanBermudanBhutaneseBlackfeetBolivianBrazilianBritishBritish West IndianBulgarianBurmeseCajunCambodianCanadianCape VerdeanCarpatho RusynCelticCentral AmericanCentral American IndianCherokeeCheyenneChickasawChileanChineseChippewaChoctawColombianColvilleComancheCosta RicanCreeCreekCroatianCrowCubanCypriotCzechCzechoslovakianDanishDelawareDominicanDutchDutch West IndianEastern EuropeanEcuadorianEgyptianEnglishEstonianEthiopianEuropeanFijianFilipinoFinnishFrenchFrench American IndianFrench CanadianGermanGerman RussianGhanaianGreekGuamanian/ChamorroGuatemalanGuyaneseHaitianHmongHonduranHopiHoumaHungarianIcelanderIndian (Asian)IndonesianInupiatIranianIraqiIrishIroquoisIsraeliItalianJamaicanJapaneseJordanianKenyanKiowaKoreanLaotianLatvianLebaneseLiberianLithuanianLumbeeLuxembourgerMacedonianMalaysianMalteseMarshalleseMenomineeMexicanMexican American IndianMongolianMoroccanNative HawaiianNavajoNepaleseNew ZealanderNicaraguanNigerianNorthern EuropeanNorwegianOkinawanOsageOttawaPaiutePakistaniPalestinianPanamanianParaguayanPennsylvania GermanPeruvianPimaPolishPortuguesePotawatomiPuebloPuerto RicanPuget Sound SalishRomanianRussianSalvadoranSamoanScandinavianScotch-IrishScottishSeminoleSenegaleseSerbianShoshoneSierra LeoneanSiouxSlavicSlovakSloveneSomaliSouth AfricanSouth AmericanSouth American IndianSoviet UnionSpaniardSpanishSpanish AmericanSpanish American IndianSri LankanSubsaharan AfricanSudaneseSwedishSwissSyrianTaiwaneseThaiTlingit-HaidaTohono O'OdhamTonganTrinidadian and TobagonianTsimshianTurkishU.S. Virgin IslanderUgandanUkrainianUruguayanUteVenezuelanVietnameseWelshWest IndianYakamaYaquiYugoslavianYumanYup'ikZimbabwean
Immigration
NonimmigrantsImmigrantsAfghanistanAfricaAlbaniaArgentinaArmeniaAsiaAustraliaAustriaBahamasBangladeshBarbadosBelarusBelgiumBelizeBoliviaBosnia and HerzegovinaBrazilBulgariaBurma/MyanmarCabo VerdeCambodiaCameroonCanadaCaribbeanCentral AmericaChileChinaColombiaCongoCosta RicaCroatiaCubaCzechoslovakiaDenmarkDominicaDominican RepublicEastern AfricaEastern AsiaEastern EuropeEcuadorEl SalvadorEnglandEritreaEthiopiaEuropeFijiFranceGermanyGhanaGreeceGrenadaGuatemalaGuyanaHaitiHondurasHong KongHungaryIndiaIndonesiaIranIraqIrelandIsraelItalyJamaicaJapanJordanKazakhstanKenyaKoreaKuwaitLaosLatin AmericaLatviaLebanonLiberiaLithuaniaMalaysiaMexicoMicronesiaMiddle AfricaMoldovaMoroccoNepalNetherlandsNicaraguaNigeriaNorth AmericaNorth MacedoniaNorthern AfricaNorthern EuropeNorwayOceaniaPakistanPanamaPeruPhilippinesPolandPortugalRomaniaRussiaSaudi ArabiaScotlandSenegalSerbiaSierra LeoneSingaporeSomaliaSouth AfricaSouth AmericaSouth Central AsiaSouth Eastern AsiaSouthern EuropeSpainSri LankaSt. Vincent and the GrenadinesSudanSwedenSwitzerlandSyriaTaiwanThailandTrinidad and TobagoTurkeyUgandaUkraineUruguayUzbekistanVenezuelaVietnamWest IndiesWestern AfricaWestern AsiaWestern EuropeYemenZaireZimbabweAzores
Immigrants from Egypt
Race
Ancestry
AfghanAfricanAlaska NativeAlaskan AthabascanAlbanianAleutAlsatianAmericanApacheArabArapahoArgentineanArmenianAssyrian/Chaldean/SyriacAustralianAustrianBahamianBangladeshiBarbadianBasqueBelgianBelizeanBermudanBhutaneseBlackfeetBolivianBrazilianBritishBritish West IndianBulgarianBurmeseCajunCambodianCanadianCape VerdeanCarpatho RusynCelticCentral AmericanCentral American IndianCherokeeCheyenneChickasawChileanChineseChippewaChoctawColombianColvilleComancheCosta RicanCreeCreekCroatianCrowCubanCypriotCzechCzechoslovakianDanishDelawareDominicanDutchDutch West IndianEastern EuropeanEcuadorianEgyptianEnglishEstonianEthiopianEuropeanFijianFilipinoFinnishFrenchFrench American IndianFrench CanadianGermanGerman RussianGhanaianGreekGuamanian/ChamorroGuatemalanGuyaneseHaitianHmongHonduranHopiHoumaHungarianIcelanderIndian (Asian)IndonesianInupiatIranianIraqiIrishIroquoisIsraeliItalianJamaicanJapaneseJordanianKenyanKiowaKoreanLaotianLatvianLebaneseLiberianLithuanianLumbeeLuxembourgerMacedonianMalaysianMalteseMarshalleseMenomineeMexicanMexican American IndianMongolianMoroccanNative HawaiianNavajoNepaleseNew ZealanderNicaraguanNigerianNorthern EuropeanNorwegianOkinawanOsageOttawaPaiutePakistaniPalestinianPanamanianParaguayanPennsylvania GermanPeruvianPimaPolishPortuguesePotawatomiPuebloPuerto RicanPuget Sound SalishRomanianRussianSalvadoranSamoanScandinavianScotch-IrishScottishSeminoleSenegaleseSerbianShoshoneSierra LeoneanSiouxSlavicSlovakSloveneSomaliSouth AfricanSouth AmericanSouth American IndianSoviet UnionSpaniardSpanishSpanish AmericanSpanish American IndianSri LankanSubsaharan AfricanSudaneseSwedishSwissSyrianTaiwaneseThaiTlingit-HaidaTohono O'OdhamTonganTrinidadian and TobagonianTsimshianTurkishU.S. Virgin IslanderUgandanUkrainianUruguayanUteVenezuelanVietnameseWelshWest IndianYakamaYaquiYugoslavianYumanYup'ikZimbabwean
Immigration
NonimmigrantsImmigrantsAfghanistanAfricaAlbaniaArgentinaArmeniaAsiaAustraliaAustriaBahamasBangladeshBarbadosBelarusBelgiumBelizeBoliviaBosnia and HerzegovinaBrazilBulgariaBurma/MyanmarCabo VerdeCambodiaCameroonCanadaCaribbeanCentral AmericaChileChinaColombiaCongoCosta RicaCroatiaCubaCzechoslovakiaDenmarkDominicaDominican RepublicEastern AfricaEastern AsiaEastern EuropeEcuadorEgyptEl SalvadorEritreaEthiopiaEuropeFijiFranceGermanyGhanaGreeceGrenadaGuatemalaGuyanaHaitiHondurasHong KongHungaryIndiaIndonesiaIranIraqIrelandIsraelItalyJamaicaJapanJordanKazakhstanKenyaKoreaKuwaitLaosLatin AmericaLatviaLebanonLiberiaLithuaniaMalaysiaMexicoMicronesiaMiddle AfricaMoldovaMoroccoNepalNetherlandsNicaraguaNigeriaNorth AmericaNorth MacedoniaNorthern AfricaNorthern EuropeNorwayOceaniaPakistanPanamaPeruPhilippinesPolandPortugalRomaniaRussiaSaudi ArabiaScotlandSenegalSerbiaSierra LeoneSingaporeSomaliaSouth AfricaSouth AmericaSouth Central AsiaSouth Eastern AsiaSouthern EuropeSpainSri LankaSt. Vincent and the GrenadinesSudanSwedenSwitzerlandSyriaTaiwanThailandTrinidad and TobagoTurkeyUgandaUkraineUruguayUzbekistanVenezuelaVietnamWest IndiesWestern AfricaWestern AsiaWestern EuropeYemenZaireZimbabweAzores
Child Poverty Under the Age of 5
Income
Poverty
Unemployment
Labor Participation
Family Structure
Vehicle Availability
Education Level
Disability

Child Poverty Under the Age of 5 Comparison

Immigrants from England

Immigrants from Egypt

Exceptional
Exceptional
16.2%
CHILD POVERTY UNDER THE AGE OF 5
91.5/ 100
METRIC RATING
127th/ 347
METRIC RANK
15.3%
CHILD POVERTY UNDER THE AGE OF 5
98.8/ 100
METRIC RATING
71st/ 347
METRIC RANK

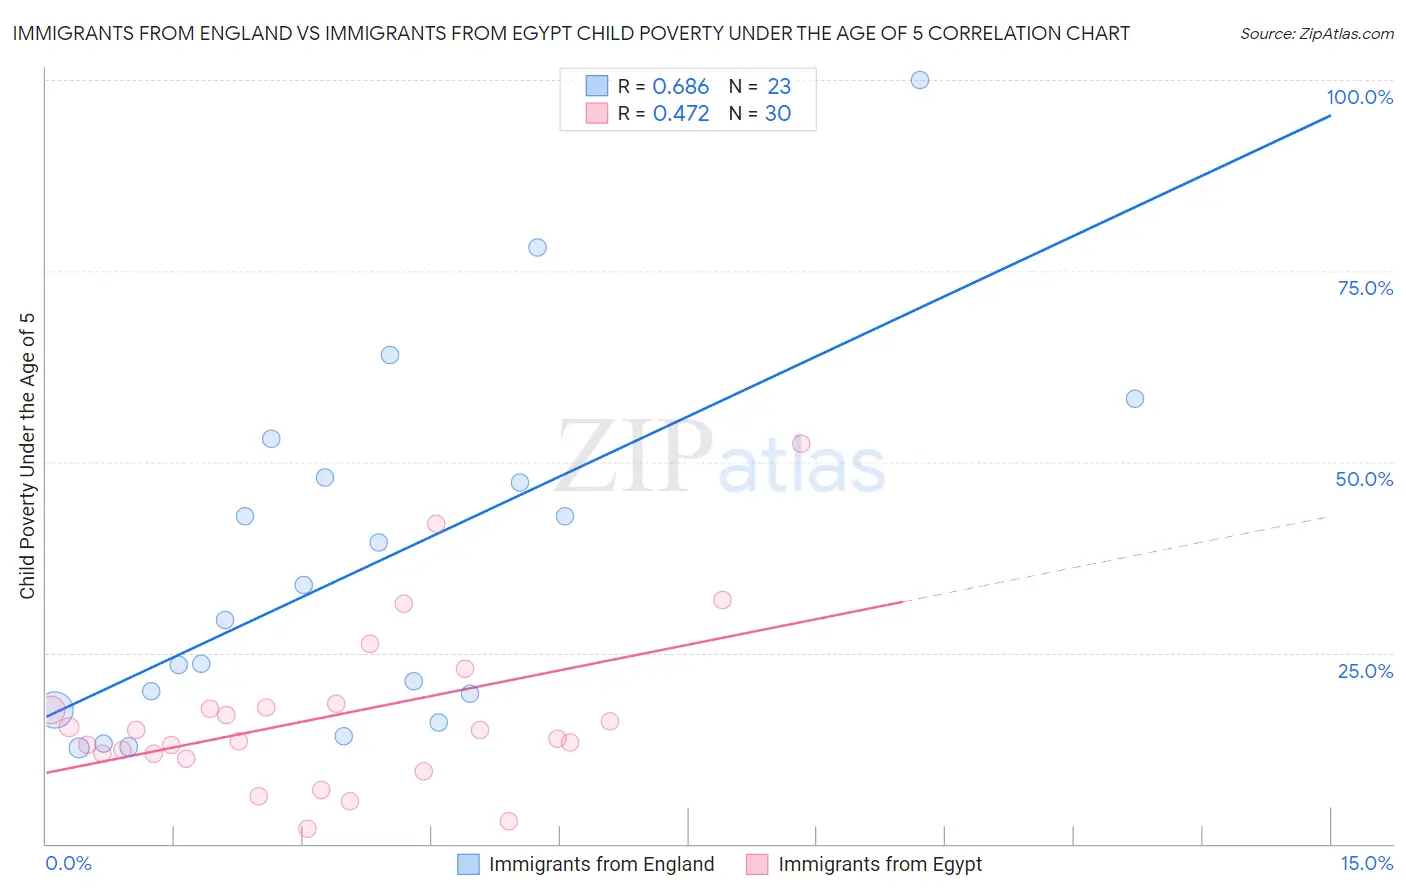
Immigrants from England vs Immigrants from Egypt Child Poverty Under the Age of 5 Correlation Chart

The statistical analysis conducted on geographies consisting of 373,543,050 people shows a significant positive correlation between the proportion of Immigrants from England and poverty level among children under the age of 5 in the United States with a correlation coefficient (R) of 0.686 and weighted average of 16.2%. Similarly, the statistical analysis conducted on geographies consisting of 237,894,270 people shows a moderate positive correlation between the proportion of Immigrants from Egypt and poverty level among children under the age of 5 in the United States with a correlation coefficient (R) of 0.472 and weighted average of 15.3%, a difference of 6.0%.
Immigrants from England vs Immigrants from Egypt Child Poverty Under the Age of 5

Child Poverty Under the Age of 5 Correlation Summary

MeasurementImmigrants from EnglandImmigrants from Egypt
Minimum12.5%1.9%
Maximum100.0%52.3%
Range87.5%50.4%
Mean36.1%16.7%
Median29.3%14.4%
Interquartile 25% (IQ1)17.6%11.8%
Interquartile 75% (IQ3)48.0%17.9%
Interquartile Range (IQR)30.5%6.1%
Standard Deviation (Sample)23.1%10.9%
Standard Deviation (Population)22.6%10.7%

Similar Demographics by Child Poverty Under the Age of 5

Demographics Similar to Immigrants from England by Child Poverty Under the Age of 5

In terms of child poverty under the age of 5, the demographic groups most similar to Immigrants from England are Immigrants from Albania (16.2%, a difference of 0.080%), Native Hawaiian (16.2%, a difference of 0.090%), Swiss (16.1%, a difference of 0.16%), Austrian (16.1%, a difference of 0.17%), and Immigrants from Southern Europe (16.1%, a difference of 0.19%).
DemographicsRating | RankChild Poverty Under the Age of 5
Immigrants | Peru
92.6
/100
|
#120
Exceptional
16.1%
Mongolians
92.5
/100
|
#121
Exceptional
16.1%
Immigrants | Southern Europe
92.0
/100
|
#122
Exceptional
16.1%
Austrians
92.0
/100
|
#123
Exceptional
16.1%
Swiss
92.0
/100
|
#124
Exceptional
16.1%
Native Hawaiians
91.8
/100
|
#125
Exceptional
16.2%
Immigrants | Albania
91.8
/100
|
#126
Exceptional
16.2%
Immigrants | England
91.5
/100
|
#127
Exceptional
16.2%
South Africans
90.1
/100
|
#128
Exceptional
16.2%
British
89.4
/100
|
#129
Excellent
16.3%
Immigrants | Norway
89.3
/100
|
#130
Excellent
16.3%
Finns
88.3
/100
|
#131
Excellent
16.3%
Serbians
88.2
/100
|
#132
Excellent
16.3%
Icelanders
87.9
/100
|
#133
Excellent
16.3%
Immigrants | North Macedonia
87.8
/100
|
#134
Excellent
16.4%

Demographics Similar to Immigrants from Egypt by Child Poverty Under the Age of 5

In terms of child poverty under the age of 5, the demographic groups most similar to Immigrants from Egypt are Immigrants from Belgium (15.3%, a difference of 0.0%), Immigrants from Sweden (15.3%, a difference of 0.070%), Immigrants from Ukraine (15.3%, a difference of 0.30%), Lithuanian (15.2%, a difference of 0.44%), and Greek (15.2%, a difference of 0.45%).
DemographicsRating | RankChild Poverty Under the Age of 5
Immigrants | Romania
99.1
/100
|
#64
Exceptional
15.2%
Immigrants | Fiji
99.0
/100
|
#65
Exceptional
15.2%
Immigrants | Scotland
99.0
/100
|
#66
Exceptional
15.2%
Greeks
99.0
/100
|
#67
Exceptional
15.2%
Zimbabweans
99.0
/100
|
#68
Exceptional
15.2%
Lithuanians
99.0
/100
|
#69
Exceptional
15.2%
Immigrants | Belgium
98.8
/100
|
#70
Exceptional
15.3%
Immigrants | Egypt
98.8
/100
|
#71
Exceptional
15.3%
Immigrants | Sweden
98.8
/100
|
#72
Exceptional
15.3%
Immigrants | Ukraine
98.7
/100
|
#73
Exceptional
15.3%
Argentineans
98.5
/100
|
#74
Exceptional
15.4%
Immigrants | Argentina
98.5
/100
|
#75
Exceptional
15.4%
Croatians
98.5
/100
|
#76
Exceptional
15.4%
Immigrants | Turkey
98.3
/100
|
#77
Exceptional
15.4%
Sri Lankans
98.1
/100
|
#78
Exceptional
15.5%