Immigrants from Egypt vs Iranian Child Poverty Under the Age of 5

COMPARE

Immigrants from Egypt
Race
Ancestry
AfghanAfricanAlaska NativeAlaskan AthabascanAlbanianAleutAlsatianAmericanApacheArabArapahoArgentineanArmenianAssyrian/Chaldean/SyriacAustralianAustrianBahamianBangladeshiBarbadianBasqueBelgianBelizeanBermudanBhutaneseBlackfeetBolivianBrazilianBritishBritish West IndianBulgarianBurmeseCajunCambodianCanadianCape VerdeanCarpatho RusynCelticCentral AmericanCentral American IndianCherokeeCheyenneChickasawChileanChineseChippewaChoctawColombianColvilleComancheCosta RicanCreeCreekCroatianCrowCubanCypriotCzechCzechoslovakianDanishDelawareDominicanDutchDutch West IndianEastern EuropeanEcuadorianEgyptianEnglishEstonianEthiopianEuropeanFijianFilipinoFinnishFrenchFrench American IndianFrench CanadianGermanGerman RussianGhanaianGreekGuamanian/ChamorroGuatemalanGuyaneseHaitianHmongHonduranHopiHoumaHungarianIcelanderIndian (Asian)IndonesianInupiatIraqiIrishIroquoisIsraeliItalianJamaicanJapaneseJordanianKenyanKiowaKoreanLaotianLatvianLebaneseLiberianLithuanianLumbeeLuxembourgerMacedonianMalaysianMalteseMarshalleseMenomineeMexicanMexican American IndianMongolianMoroccanNative HawaiianNavajoNepaleseNew ZealanderNicaraguanNigerianNorthern EuropeanNorwegianOkinawanOsageOttawaPaiutePakistaniPalestinianPanamanianParaguayanPennsylvania GermanPeruvianPimaPolishPortuguesePotawatomiPuebloPuerto RicanPuget Sound SalishRomanianRussianSalvadoranSamoanScandinavianScotch-IrishScottishSeminoleSenegaleseSerbianShoshoneSierra LeoneanSiouxSlavicSlovakSloveneSomaliSouth AfricanSouth AmericanSouth American IndianSoviet UnionSpaniardSpanishSpanish AmericanSpanish American IndianSri LankanSubsaharan AfricanSudaneseSwedishSwissSyrianTaiwaneseThaiTlingit-HaidaTohono O'OdhamTonganTrinidadian and TobagonianTsimshianTurkishU.S. Virgin IslanderUgandanUkrainianUruguayanUteVenezuelanVietnameseWelshWest IndianYakamaYaquiYugoslavianYumanYup'ikZimbabwean
Immigration
NonimmigrantsImmigrantsAfghanistanAfricaAlbaniaArgentinaArmeniaAsiaAustraliaAustriaBahamasBangladeshBarbadosBelarusBelgiumBelizeBoliviaBosnia and HerzegovinaBrazilBulgariaBurma/MyanmarCabo VerdeCambodiaCameroonCanadaCaribbeanCentral AmericaChileChinaColombiaCongoCosta RicaCroatiaCubaCzechoslovakiaDenmarkDominicaDominican RepublicEastern AfricaEastern AsiaEastern EuropeEcuadorEgyptEl SalvadorEnglandEritreaEthiopiaEuropeFijiFranceGermanyGhanaGreeceGrenadaGuatemalaGuyanaHaitiHondurasHong KongHungaryIndiaIndonesiaIranIraqIrelandIsraelItalyJamaicaJapanJordanKazakhstanKenyaKoreaKuwaitLaosLatin AmericaLatviaLebanonLiberiaLithuaniaMalaysiaMexicoMicronesiaMiddle AfricaMoldovaMoroccoNepalNetherlandsNicaraguaNigeriaNorth AmericaNorth MacedoniaNorthern AfricaNorthern EuropeNorwayOceaniaPakistanPanamaPeruPhilippinesPolandPortugalRomaniaRussiaSaudi ArabiaScotlandSenegalSerbiaSierra LeoneSingaporeSomaliaSouth AfricaSouth AmericaSouth Central AsiaSouth Eastern AsiaSouthern EuropeSpainSri LankaSt. Vincent and the GrenadinesSudanSwedenSwitzerlandSyriaTaiwanThailandTrinidad and TobagoTurkeyUgandaUkraineUruguayUzbekistanVenezuelaVietnamWest IndiesWestern AfricaWestern AsiaWestern EuropeYemenZaireZimbabweAzores
Iranian
Race
Ancestry
AfghanAfricanAlaska NativeAlaskan AthabascanAlbanianAleutAlsatianAmericanApacheArabArapahoArgentineanArmenianAssyrian/Chaldean/SyriacAustralianAustrianBahamianBangladeshiBarbadianBasqueBelgianBelizeanBermudanBhutaneseBlackfeetBolivianBrazilianBritishBritish West IndianBulgarianBurmeseCajunCambodianCanadianCape VerdeanCarpatho RusynCelticCentral AmericanCentral American IndianCherokeeCheyenneChickasawChileanChineseChippewaChoctawColombianColvilleComancheCosta RicanCreeCreekCroatianCrowCubanCypriotCzechCzechoslovakianDanishDelawareDominicanDutchDutch West IndianEastern EuropeanEcuadorianEgyptianEnglishEstonianEthiopianEuropeanFijianFilipinoFinnishFrenchFrench American IndianFrench CanadianGermanGerman RussianGhanaianGreekGuamanian/ChamorroGuatemalanGuyaneseHaitianHmongHonduranHopiHoumaHungarianIcelanderIndian (Asian)IndonesianInupiatIranianIraqiIrishIroquoisIsraeliItalianJamaicanJapaneseJordanianKenyanKiowaKoreanLaotianLatvianLebaneseLiberianLithuanianLumbeeLuxembourgerMacedonianMalaysianMalteseMarshalleseMenomineeMexicanMexican American IndianMongolianMoroccanNative HawaiianNavajoNepaleseNew ZealanderNicaraguanNigerianNorthern EuropeanNorwegianOkinawanOsageOttawaPaiutePakistaniPalestinianPanamanianParaguayanPennsylvania GermanPeruvianPimaPolishPortuguesePotawatomiPuebloPuerto RicanPuget Sound SalishRomanianRussianSalvadoranSamoanScandinavianScotch-IrishScottishSeminoleSenegaleseSerbianShoshoneSierra LeoneanSiouxSlavicSlovakSloveneSomaliSouth AfricanSouth AmericanSouth American IndianSoviet UnionSpaniardSpanishSpanish AmericanSpanish American IndianSri LankanSubsaharan AfricanSudaneseSwedishSwissSyrianTaiwaneseThaiTlingit-HaidaTohono O'OdhamTonganTrinidadian and TobagonianTsimshianTurkishU.S. Virgin IslanderUgandanUkrainianUruguayanUteVenezuelanVietnameseWelshWest IndianYakamaYaquiYugoslavianYumanYup'ikZimbabwean
Immigration
NonimmigrantsImmigrantsAfghanistanAfricaAlbaniaArgentinaArmeniaAsiaAustraliaAustriaBahamasBangladeshBarbadosBelarusBelgiumBelizeBoliviaBosnia and HerzegovinaBrazilBulgariaBurma/MyanmarCabo VerdeCambodiaCameroonCanadaCaribbeanCentral AmericaChileChinaColombiaCongoCosta RicaCroatiaCubaCzechoslovakiaDenmarkDominicaDominican RepublicEastern AfricaEastern AsiaEastern EuropeEcuadorEl SalvadorEnglandEritreaEthiopiaEuropeFijiFranceGermanyGhanaGreeceGrenadaGuatemalaGuyanaHaitiHondurasHong KongHungaryIndiaIndonesiaIranIraqIrelandIsraelItalyJamaicaJapanJordanKazakhstanKenyaKoreaKuwaitLaosLatin AmericaLatviaLebanonLiberiaLithuaniaMalaysiaMexicoMicronesiaMiddle AfricaMoldovaMoroccoNepalNetherlandsNicaraguaNigeriaNorth AmericaNorth MacedoniaNorthern AfricaNorthern EuropeNorwayOceaniaPakistanPanamaPeruPhilippinesPolandPortugalRomaniaRussiaSaudi ArabiaScotlandSenegalSerbiaSierra LeoneSingaporeSomaliaSouth AfricaSouth AmericaSouth Central AsiaSouth Eastern AsiaSouthern EuropeSpainSri LankaSt. Vincent and the GrenadinesSudanSwedenSwitzerlandSyriaTaiwanThailandTrinidad and TobagoTurkeyUgandaUkraineUruguayUzbekistanVenezuelaVietnamWest IndiesWestern AfricaWestern AsiaWestern EuropeYemenZaireZimbabweAzores
Child Poverty Under the Age of 5
Income
Poverty
Unemployment
Labor Participation
Family Structure
Vehicle Availability
Education Level
Disability

Child Poverty Under the Age of 5 Comparison

Immigrants from Egypt

Iranians

Exceptional
Exceptional
15.3%
CHILD POVERTY UNDER THE AGE OF 5
98.8/ 100
METRIC RATING
71st/ 347
METRIC RANK
13.1%
CHILD POVERTY UNDER THE AGE OF 5
100.0/ 100
METRIC RATING
8th/ 347
METRIC RANK

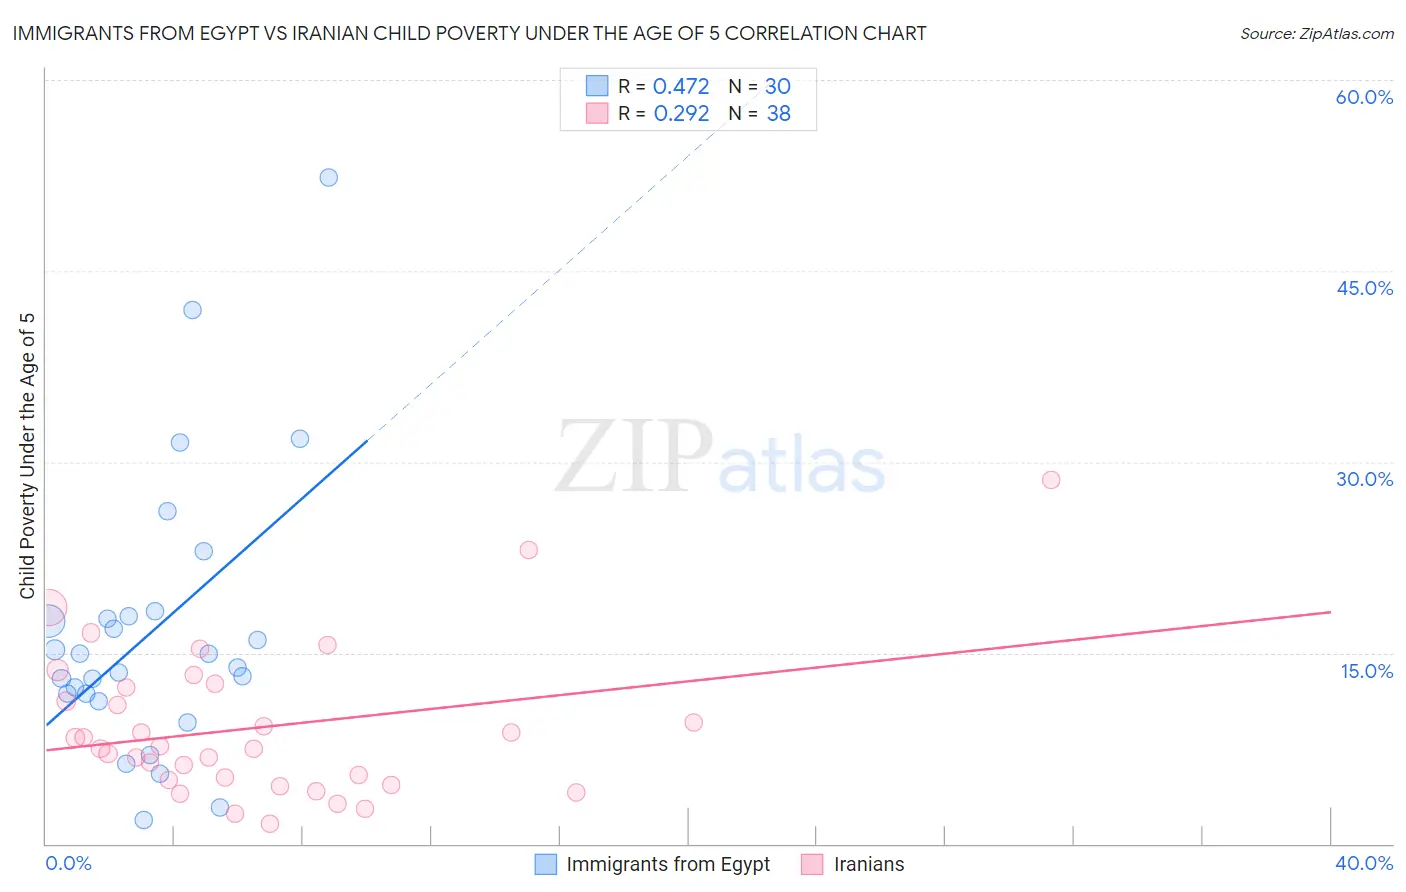
Immigrants from Egypt vs Iranian Child Poverty Under the Age of 5 Correlation Chart

The statistical analysis conducted on geographies consisting of 237,894,270 people shows a moderate positive correlation between the proportion of Immigrants from Egypt and poverty level among children under the age of 5 in the United States with a correlation coefficient (R) of 0.472 and weighted average of 15.3%. Similarly, the statistical analysis conducted on geographies consisting of 304,435,638 people shows a weak positive correlation between the proportion of Iranians and poverty level among children under the age of 5 in the United States with a correlation coefficient (R) of 0.292 and weighted average of 13.1%, a difference of 16.8%.
Immigrants from Egypt vs Iranian Child Poverty Under the Age of 5

Child Poverty Under the Age of 5 Correlation Summary

MeasurementImmigrants from EgyptIranian
Minimum1.9%1.6%
Maximum52.3%28.6%
Range50.4%27.0%
Mean16.7%9.1%
Median14.4%7.6%
Interquartile 25% (IQ1)11.8%5.0%
Interquartile 75% (IQ3)17.9%12.3%
Interquartile Range (IQR)6.1%7.3%
Standard Deviation (Sample)10.9%5.8%
Standard Deviation (Population)10.7%5.7%

Similar Demographics by Child Poverty Under the Age of 5

Demographics Similar to Immigrants from Egypt by Child Poverty Under the Age of 5

In terms of child poverty under the age of 5, the demographic groups most similar to Immigrants from Egypt are Immigrants from Belgium (15.3%, a difference of 0.0%), Immigrants from Sweden (15.3%, a difference of 0.070%), Immigrants from Ukraine (15.3%, a difference of 0.30%), Lithuanian (15.2%, a difference of 0.44%), and Greek (15.2%, a difference of 0.45%).
DemographicsRating | RankChild Poverty Under the Age of 5
Immigrants | Romania
99.1
/100
|
#64
Exceptional
15.2%
Immigrants | Fiji
99.0
/100
|
#65
Exceptional
15.2%
Immigrants | Scotland
99.0
/100
|
#66
Exceptional
15.2%
Greeks
99.0
/100
|
#67
Exceptional
15.2%
Zimbabweans
99.0
/100
|
#68
Exceptional
15.2%
Lithuanians
99.0
/100
|
#69
Exceptional
15.2%
Immigrants | Belgium
98.8
/100
|
#70
Exceptional
15.3%
Immigrants | Egypt
98.8
/100
|
#71
Exceptional
15.3%
Immigrants | Sweden
98.8
/100
|
#72
Exceptional
15.3%
Immigrants | Ukraine
98.7
/100
|
#73
Exceptional
15.3%
Argentineans
98.5
/100
|
#74
Exceptional
15.4%
Immigrants | Argentina
98.5
/100
|
#75
Exceptional
15.4%
Croatians
98.5
/100
|
#76
Exceptional
15.4%
Immigrants | Turkey
98.3
/100
|
#77
Exceptional
15.4%
Sri Lankans
98.1
/100
|
#78
Exceptional
15.5%

Demographics Similar to Iranians by Child Poverty Under the Age of 5

In terms of child poverty under the age of 5, the demographic groups most similar to Iranians are Chinese (13.1%, a difference of 0.020%), Immigrants from Iran (13.1%, a difference of 0.16%), Immigrants from Singapore (12.9%, a difference of 1.0%), Burmese (13.2%, a difference of 1.3%), and Immigrants from Korea (13.2%, a difference of 1.4%).
DemographicsRating | RankChild Poverty Under the Age of 5
Immigrants | India
100.0
/100
|
#1
Exceptional
11.5%
Immigrants | Taiwan
100.0
/100
|
#2
Exceptional
11.6%
Filipinos
100.0
/100
|
#3
Exceptional
11.6%
Thais
100.0
/100
|
#4
Exceptional
12.3%
Immigrants | Hong Kong
100.0
/100
|
#5
Exceptional
12.4%
Immigrants | Singapore
100.0
/100
|
#6
Exceptional
12.9%
Chinese
100.0
/100
|
#7
Exceptional
13.1%
Iranians
100.0
/100
|
#8
Exceptional
13.1%
Immigrants | Iran
100.0
/100
|
#9
Exceptional
13.1%
Burmese
100.0
/100
|
#10
Exceptional
13.2%
Immigrants | Korea
100.0
/100
|
#11
Exceptional
13.2%
Immigrants | South Central Asia
100.0
/100
|
#12
Exceptional
13.3%
Bhutanese
100.0
/100
|
#13
Exceptional
13.4%
Okinawans
100.0
/100
|
#14
Exceptional
13.4%
Indians (Asian)
100.0
/100
|
#15
Exceptional
13.4%