Immigrants from Egypt vs Immigrants from Singapore Family Poverty
COMPARE
Immigrants from Egypt
Immigrants from Singapore
Family Poverty
Family Poverty Comparison
Immigrants from Egypt
Immigrants from Singapore
8.3%
FAMILY POVERTY
91.6/ 100
METRIC RATING
120th/ 347
METRIC RANK
7.1%
FAMILY POVERTY
99.8/ 100
METRIC RATING
11th/ 347
METRIC RANK
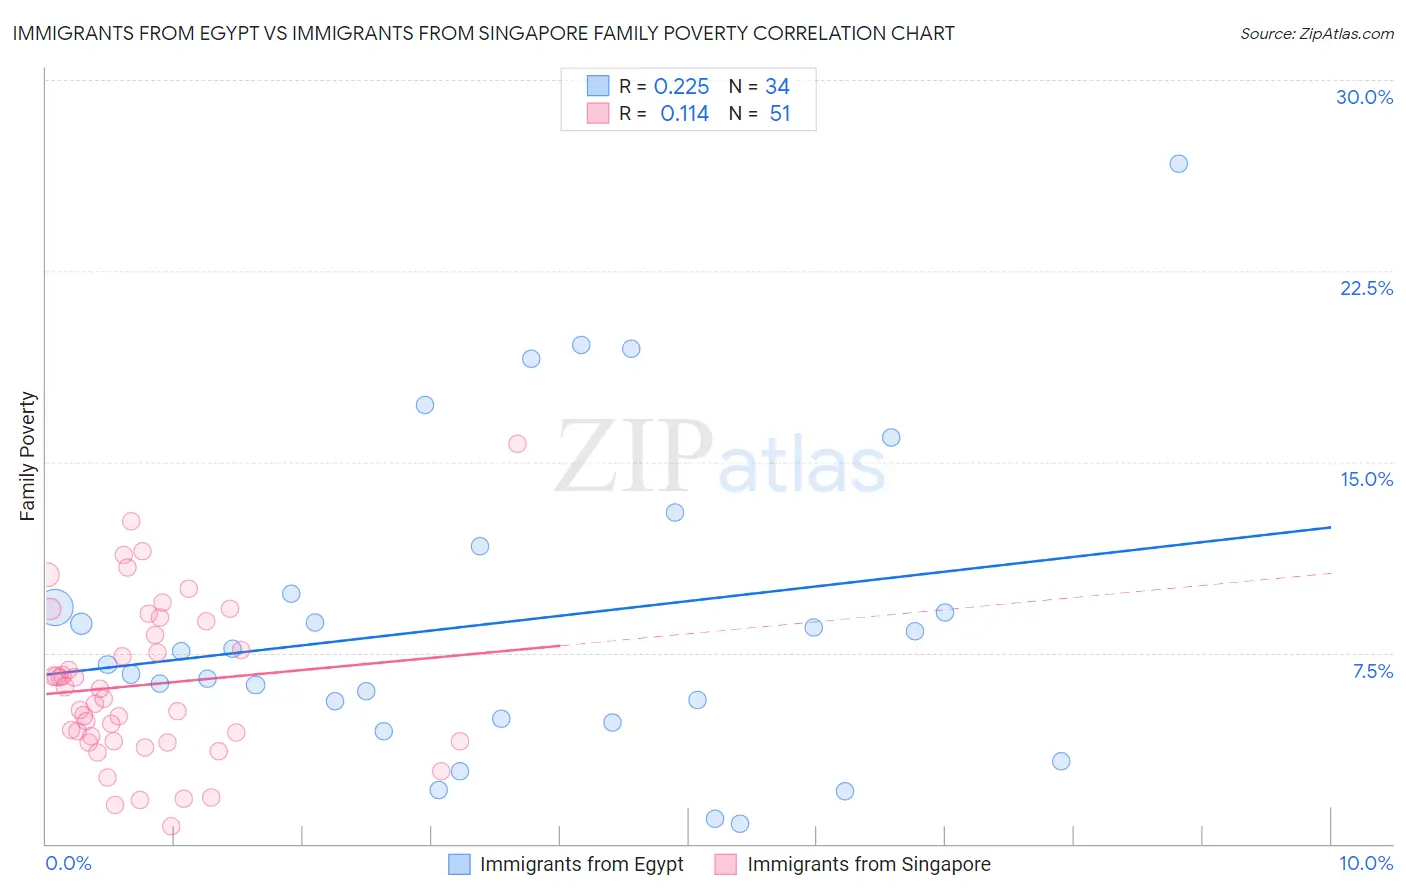
Immigrants from Egypt vs Immigrants from Singapore Family Poverty Correlation Chart
The statistical analysis conducted on geographies consisting of 245,176,811 people shows a weak positive correlation between the proportion of Immigrants from Egypt and poverty level among families in the United States with a correlation coefficient (R) of 0.225 and weighted average of 8.3%. Similarly, the statistical analysis conducted on geographies consisting of 137,322,674 people shows a poor positive correlation between the proportion of Immigrants from Singapore and poverty level among families in the United States with a correlation coefficient (R) of 0.114 and weighted average of 7.1%, a difference of 17.0%.
Family Poverty Correlation Summary
| Measurement | Immigrants from Egypt | Immigrants from Singapore |
| Minimum | 0.80% | 0.70% |
| Maximum | 26.7% | 15.7% |
| Range | 25.9% | 15.0% |
| Mean | 8.7% | 6.2% |
| Median | 7.3% | 5.7% |
| Interquartile 25% (IQ1) | 4.9% | 4.0% |
| Interquartile 75% (IQ3) | 9.8% | 8.8% |
| Interquartile Range (IQR) | 4.9% | 4.8% |
| Standard Deviation (Sample) | 6.0% | 3.2% |
| Standard Deviation (Population) | 5.9% | 3.1% |
Similar Demographics by Family Poverty
Demographics Similar to Immigrants from Egypt by Family Poverty
In terms of family poverty, the demographic groups most similar to Immigrants from Egypt are Native Hawaiian (8.3%, a difference of 0.17%), Paraguayan (8.3%, a difference of 0.18%), Palestinian (8.3%, a difference of 0.25%), Soviet Union (8.3%, a difference of 0.35%), and Pakistani (8.3%, a difference of 0.39%).
| Demographics | Rating | Rank | Family Poverty |
| Canadians | 94.2 /100 | #113 | Exceptional 8.2% |
| Immigrants | Zimbabwe | 94.0 /100 | #114 | Exceptional 8.2% |
| Immigrants | Israel | 93.5 /100 | #115 | Exceptional 8.2% |
| South Africans | 93.4 /100 | #116 | Exceptional 8.2% |
| Immigrants | Russia | 93.2 /100 | #117 | Exceptional 8.2% |
| Immigrants | Western Europe | 92.9 /100 | #118 | Exceptional 8.2% |
| French | 92.8 /100 | #119 | Exceptional 8.3% |
| Immigrants | Egypt | 91.6 /100 | #120 | Exceptional 8.3% |
| Native Hawaiians | 91.3 /100 | #121 | Exceptional 8.3% |
| Paraguayans | 91.2 /100 | #122 | Exceptional 8.3% |
| Palestinians | 91.1 /100 | #123 | Exceptional 8.3% |
| Soviet Union | 90.8 /100 | #124 | Exceptional 8.3% |
| Pakistanis | 90.8 /100 | #125 | Exceptional 8.3% |
| Icelanders | 90.3 /100 | #126 | Exceptional 8.3% |
| Immigrants | Hungary | 89.9 /100 | #127 | Excellent 8.4% |
Demographics Similar to Immigrants from Singapore by Family Poverty
In terms of family poverty, the demographic groups most similar to Immigrants from Singapore are Bulgarian (7.1%, a difference of 0.010%), Latvian (7.1%, a difference of 0.27%), Maltese (7.1%, a difference of 0.29%), Swedish (7.1%, a difference of 0.34%), and Iranian (7.1%, a difference of 0.34%).
| Demographics | Rating | Rank | Family Poverty |
| Filipinos | 100.0 /100 | #4 | Exceptional 6.6% |
| Thais | 100.0 /100 | #5 | Exceptional 6.7% |
| Norwegians | 99.9 /100 | #6 | Exceptional 6.9% |
| Immigrants | Ireland | 99.9 /100 | #7 | Exceptional 7.0% |
| Bhutanese | 99.9 /100 | #8 | Exceptional 7.0% |
| Latvians | 99.9 /100 | #9 | Exceptional 7.1% |
| Bulgarians | 99.8 /100 | #10 | Exceptional 7.1% |
| Immigrants | Singapore | 99.8 /100 | #11 | Exceptional 7.1% |
| Maltese | 99.8 /100 | #12 | Exceptional 7.1% |
| Swedes | 99.8 /100 | #13 | Exceptional 7.1% |
| Iranians | 99.8 /100 | #14 | Exceptional 7.1% |
| Lithuanians | 99.8 /100 | #15 | Exceptional 7.2% |
| Immigrants | South Central Asia | 99.8 /100 | #16 | Exceptional 7.2% |
| Luxembourgers | 99.8 /100 | #17 | Exceptional 7.2% |
| Immigrants | Lithuania | 99.8 /100 | #18 | Exceptional 7.2% |