Immigrants from Eastern Europe vs Comanche Male Poverty

COMPARE

Immigrants from Eastern Europe
Race
Ancestry
AfghanAfricanAlaska NativeAlaskan AthabascanAlbanianAleutAlsatianAmericanApacheArabArapahoArgentineanArmenianAssyrian/Chaldean/SyriacAustralianAustrianBahamianBangladeshiBarbadianBasqueBelgianBelizeanBermudanBhutaneseBlackfeetBolivianBrazilianBritishBritish West IndianBulgarianBurmeseCajunCambodianCanadianCape VerdeanCarpatho RusynCelticCentral AmericanCentral American IndianCherokeeCheyenneChickasawChileanChineseChippewaChoctawColombianColvilleCosta RicanCreeCreekCroatianCrowCubanCypriotCzechCzechoslovakianDanishDelawareDominicanDutchDutch West IndianEastern EuropeanEcuadorianEgyptianEnglishEstonianEthiopianEuropeanFijianFilipinoFinnishFrenchFrench American IndianFrench CanadianGermanGerman RussianGhanaianGreekGuamanian/ChamorroGuatemalanGuyaneseHaitianHmongHonduranHopiHoumaHungarianIcelanderIndian (Asian)IndonesianInupiatIranianIraqiIrishIroquoisIsraeliItalianJamaicanJapaneseJordanianKenyanKiowaKoreanLaotianLatvianLebaneseLiberianLithuanianLumbeeLuxembourgerMacedonianMalaysianMalteseMarshalleseMenomineeMexicanMexican American IndianMongolianMoroccanNative HawaiianNavajoNepaleseNew ZealanderNicaraguanNigerianNorthern EuropeanNorwegianOkinawanOsageOttawaPaiutePakistaniPalestinianPanamanianParaguayanPennsylvania GermanPeruvianPimaPolishPortuguesePotawatomiPuebloPuerto RicanPuget Sound SalishRomanianRussianSalvadoranSamoanScandinavianScotch-IrishScottishSeminoleSenegaleseSerbianShoshoneSierra LeoneanSiouxSlavicSlovakSloveneSomaliSouth AfricanSouth AmericanSouth American IndianSoviet UnionSpaniardSpanishSpanish AmericanSpanish American IndianSri LankanSubsaharan AfricanSudaneseSwedishSwissSyrianTaiwaneseThaiTlingit-HaidaTohono O'OdhamTonganTrinidadian and TobagonianTsimshianTurkishU.S. Virgin IslanderUgandanUkrainianUruguayanUteVenezuelanVietnameseWelshWest IndianYakamaYaquiYugoslavianYumanYup'ikZimbabwean
Immigration
NonimmigrantsImmigrantsAfghanistanAfricaAlbaniaArgentinaArmeniaAsiaAustraliaAustriaBahamasBangladeshBarbadosBelarusBelgiumBelizeBoliviaBosnia and HerzegovinaBrazilBulgariaBurma/MyanmarCabo VerdeCambodiaCameroonCanadaCaribbeanCentral AmericaChileChinaColombiaCongoCosta RicaCroatiaCubaCzechoslovakiaDenmarkDominicaDominican RepublicEastern AfricaEastern AsiaEastern EuropeEcuadorEgyptEl SalvadorEnglandEritreaEthiopiaEuropeFijiFranceGermanyGhanaGreeceGrenadaGuatemalaGuyanaHaitiHondurasHong KongHungaryIndiaIndonesiaIranIraqIrelandIsraelItalyJamaicaJapanJordanKazakhstanKenyaKoreaKuwaitLaosLatin AmericaLatviaLebanonLiberiaLithuaniaMalaysiaMexicoMicronesiaMiddle AfricaMoldovaMoroccoNepalNetherlandsNicaraguaNigeriaNorth AmericaNorth MacedoniaNorthern AfricaNorthern EuropeNorwayOceaniaPakistanPanamaPeruPhilippinesPolandPortugalRomaniaRussiaSaudi ArabiaScotlandSenegalSerbiaSierra LeoneSingaporeSomaliaSouth AfricaSouth AmericaSouth Central AsiaSouth Eastern AsiaSouthern EuropeSpainSri LankaSt. Vincent and the GrenadinesSudanSwedenSwitzerlandSyriaTaiwanThailandTrinidad and TobagoTurkeyUgandaUkraineUruguayUzbekistanVenezuelaVietnamWest IndiesWestern AfricaWestern AsiaWestern EuropeYemenZaireZimbabweAzores
Comanche
Race
Ancestry
AfghanAfricanAlaska NativeAlaskan AthabascanAlbanianAleutAlsatianAmericanApacheArabArapahoArgentineanArmenianAssyrian/Chaldean/SyriacAustralianAustrianBahamianBangladeshiBarbadianBasqueBelgianBelizeanBermudanBhutaneseBlackfeetBolivianBrazilianBritishBritish West IndianBulgarianBurmeseCajunCambodianCanadianCape VerdeanCarpatho RusynCelticCentral AmericanCentral American IndianCherokeeCheyenneChickasawChileanChineseChippewaChoctawColombianColvilleComancheCosta RicanCreeCreekCroatianCrowCubanCypriotCzechCzechoslovakianDanishDelawareDominicanDutchDutch West IndianEastern EuropeanEcuadorianEgyptianEnglishEstonianEthiopianEuropeanFijianFilipinoFinnishFrenchFrench American IndianFrench CanadianGermanGerman RussianGhanaianGreekGuamanian/ChamorroGuatemalanGuyaneseHaitianHmongHonduranHopiHoumaHungarianIcelanderIndian (Asian)IndonesianInupiatIranianIraqiIrishIroquoisIsraeliItalianJamaicanJapaneseJordanianKenyanKiowaKoreanLaotianLatvianLebaneseLiberianLithuanianLumbeeLuxembourgerMacedonianMalaysianMalteseMarshalleseMenomineeMexicanMexican American IndianMongolianMoroccanNative HawaiianNavajoNepaleseNew ZealanderNicaraguanNigerianNorthern EuropeanNorwegianOkinawanOsageOttawaPaiutePakistaniPalestinianPanamanianParaguayanPennsylvania GermanPeruvianPimaPolishPortuguesePotawatomiPuebloPuerto RicanPuget Sound SalishRomanianRussianSalvadoranSamoanScandinavianScotch-IrishScottishSeminoleSenegaleseSerbianShoshoneSierra LeoneanSiouxSlavicSlovakSloveneSomaliSouth AfricanSouth AmericanSouth American IndianSoviet UnionSpaniardSpanishSpanish AmericanSpanish American IndianSri LankanSubsaharan AfricanSudaneseSwedishSwissSyrianTaiwaneseThaiTlingit-HaidaTohono O'OdhamTonganTrinidadian and TobagonianTsimshianTurkishU.S. Virgin IslanderUgandanUkrainianUruguayanUteVenezuelanVietnameseWelshWest IndianYakamaYaquiYugoslavianYumanYup'ikZimbabwean
Immigration
NonimmigrantsImmigrantsAfghanistanAfricaAlbaniaArgentinaArmeniaAsiaAustraliaAustriaBahamasBangladeshBarbadosBelarusBelgiumBelizeBoliviaBosnia and HerzegovinaBrazilBulgariaBurma/MyanmarCabo VerdeCambodiaCameroonCanadaCaribbeanCentral AmericaChileChinaColombiaCongoCosta RicaCroatiaCubaCzechoslovakiaDenmarkDominicaDominican RepublicEastern AfricaEastern AsiaEcuadorEgyptEl SalvadorEnglandEritreaEthiopiaEuropeFijiFranceGermanyGhanaGreeceGrenadaGuatemalaGuyanaHaitiHondurasHong KongHungaryIndiaIndonesiaIranIraqIrelandIsraelItalyJamaicaJapanJordanKazakhstanKenyaKoreaKuwaitLaosLatin AmericaLatviaLebanonLiberiaLithuaniaMalaysiaMexicoMicronesiaMiddle AfricaMoldovaMoroccoNepalNetherlandsNicaraguaNigeriaNorth AmericaNorth MacedoniaNorthern AfricaNorthern EuropeNorwayOceaniaPakistanPanamaPeruPhilippinesPolandPortugalRomaniaRussiaSaudi ArabiaScotlandSenegalSerbiaSierra LeoneSingaporeSomaliaSouth AfricaSouth AmericaSouth Central AsiaSouth Eastern AsiaSouthern EuropeSpainSri LankaSt. Vincent and the GrenadinesSudanSwedenSwitzerlandSyriaTaiwanThailandTrinidad and TobagoTurkeyUgandaUkraineUruguayUzbekistanVenezuelaVietnamWest IndiesWestern AfricaWestern AsiaWestern EuropeYemenZaireZimbabweAzores
Male Poverty
Income
Poverty
Unemployment
Labor Participation
Family Structure
Vehicle Availability
Education Level
Disability

Male Poverty Comparison

Immigrants from Eastern Europe

Comanche

Exceptional
Tragic
10.2%
MALE POVERTY
96.9/ 100
METRIC RATING
74th/ 347
METRIC RANK
13.8%
MALE POVERTY
0.0/ 100
METRIC RATING
283rd/ 347
METRIC RANK

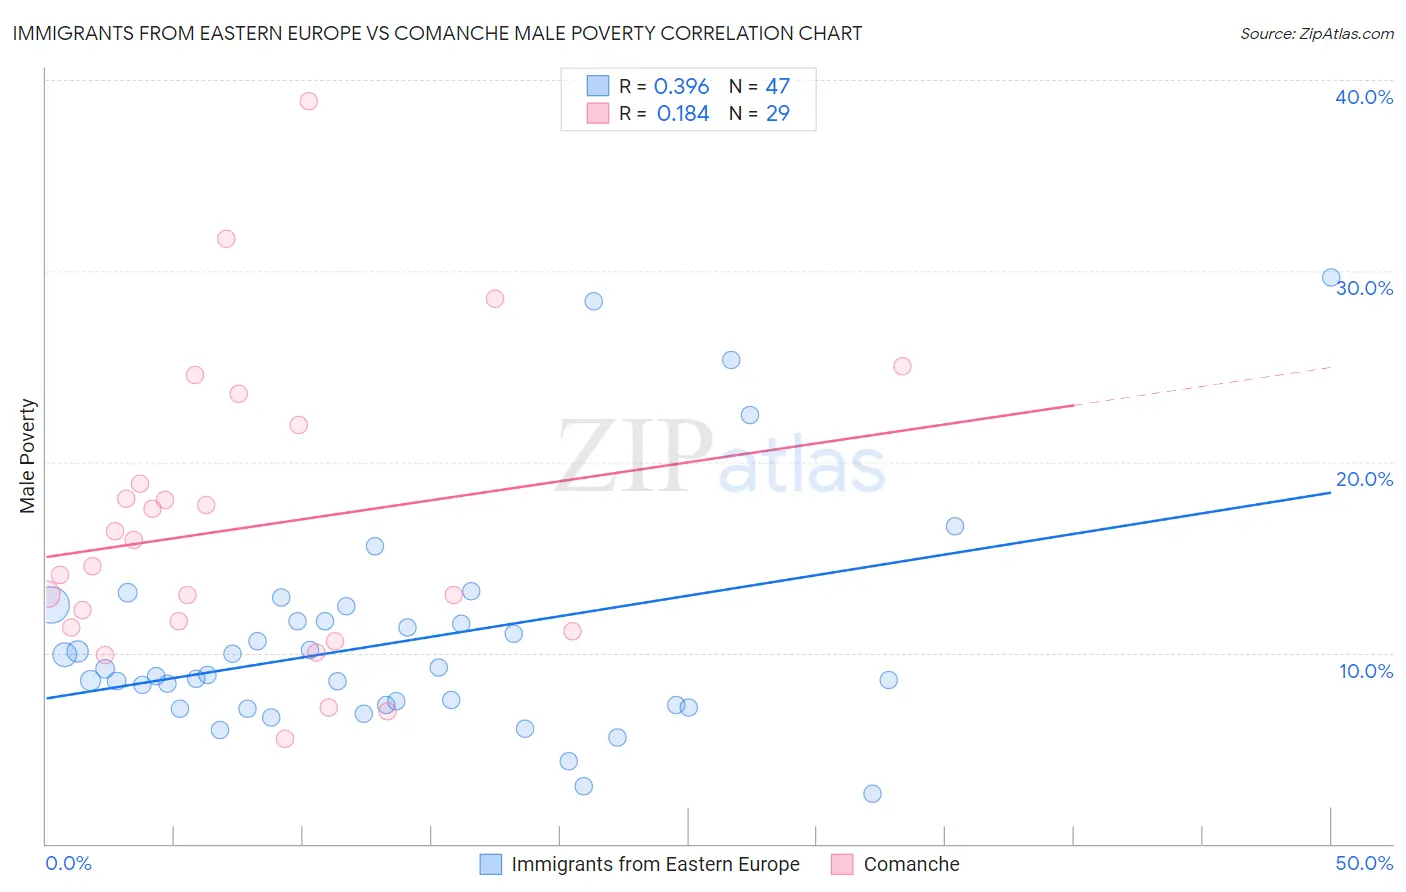
Immigrants from Eastern Europe vs Comanche Male Poverty Correlation Chart

The statistical analysis conducted on geographies consisting of 475,131,955 people shows a mild positive correlation between the proportion of Immigrants from Eastern Europe and poverty level among males in the United States with a correlation coefficient (R) of 0.396 and weighted average of 10.2%. Similarly, the statistical analysis conducted on geographies consisting of 109,752,173 people shows a poor positive correlation between the proportion of Comanche and poverty level among males in the United States with a correlation coefficient (R) of 0.184 and weighted average of 13.8%, a difference of 34.2%.
Immigrants from Eastern Europe vs Comanche Male Poverty

Male Poverty Correlation Summary

MeasurementImmigrants from Eastern EuropeComanche
Minimum2.6%5.5%
Maximum29.6%38.9%
Range27.0%33.4%
Mean10.6%16.6%
Median8.8%14.6%
Interquartile 25% (IQ1)7.3%11.2%
Interquartile 75% (IQ3)11.7%20.4%
Interquartile Range (IQR)4.4%9.2%
Standard Deviation (Sample)5.7%7.7%
Standard Deviation (Population)5.7%7.6%

Similar Demographics by Male Poverty

Demographics Similar to Immigrants from Eastern Europe by Male Poverty

In terms of male poverty, the demographic groups most similar to Immigrants from Eastern Europe are Carpatho Rusyn (10.2%, a difference of 0.0%), Dutch (10.2%, a difference of 0.010%), Immigrants from Belgium (10.3%, a difference of 0.040%), Immigrants from Asia (10.2%, a difference of 0.070%), and Irish (10.3%, a difference of 0.070%).
DemographicsRating | RankMale Poverty
Immigrants | Netherlands
97.3
/100
|
#67
Exceptional
10.2%
Immigrants | Sri Lanka
97.2
/100
|
#68
Exceptional
10.2%
Immigrants | Australia
97.1
/100
|
#69
Exceptional
10.2%
Paraguayans
97.1
/100
|
#70
Exceptional
10.2%
Europeans
97.1
/100
|
#71
Exceptional
10.2%
Immigrants | Canada
97.1
/100
|
#72
Exceptional
10.2%
Immigrants | Asia
97.0
/100
|
#73
Exceptional
10.2%
Immigrants | Eastern Europe
96.9
/100
|
#74
Exceptional
10.2%
Carpatho Rusyns
96.9
/100
|
#75
Exceptional
10.2%
Dutch
96.9
/100
|
#76
Exceptional
10.2%
Immigrants | Belgium
96.8
/100
|
#77
Exceptional
10.3%
Irish
96.8
/100
|
#78
Exceptional
10.3%
Immigrants | North America
96.5
/100
|
#79
Exceptional
10.3%
English
96.4
/100
|
#80
Exceptional
10.3%
Belgians
95.9
/100
|
#81
Exceptional
10.3%

Demographics Similar to Comanche by Male Poverty

In terms of male poverty, the demographic groups most similar to Comanche are Immigrants from Haiti (13.8%, a difference of 0.010%), West Indian (13.8%, a difference of 0.020%), Shoshone (13.8%, a difference of 0.050%), Immigrants from Barbados (13.8%, a difference of 0.070%), and Immigrants from Cabo Verde (13.7%, a difference of 0.20%).
DemographicsRating | RankMale Poverty
Immigrants | Latin America
0.0
/100
|
#276
Tragic
13.6%
Bangladeshis
0.0
/100
|
#277
Tragic
13.6%
Belizeans
0.0
/100
|
#278
Tragic
13.6%
Haitians
0.0
/100
|
#279
Tragic
13.7%
Mexicans
0.0
/100
|
#280
Tragic
13.7%
Yaqui
0.0
/100
|
#281
Tragic
13.7%
Immigrants | Cabo Verde
0.0
/100
|
#282
Tragic
13.7%
Comanche
0.0
/100
|
#283
Tragic
13.8%
Immigrants | Haiti
0.0
/100
|
#284
Tragic
13.8%
West Indians
0.0
/100
|
#285
Tragic
13.8%
Shoshone
0.0
/100
|
#286
Tragic
13.8%
Immigrants | Barbados
0.0
/100
|
#287
Tragic
13.8%
Immigrants | St. Vincent and the Grenadines
0.0
/100
|
#288
Tragic
13.8%
Guatemalans
0.0
/100
|
#289
Tragic
13.8%
Immigrants | Zaire
0.0
/100
|
#290
Tragic
13.8%