Immigrants from Eastern Africa vs Pakistani Seniors Poverty Over the Age of 75

COMPARE

Immigrants from Eastern Africa
Race
Ancestry
AfghanAfricanAlaska NativeAlaskan AthabascanAlbanianAleutAlsatianAmericanApacheArabArapahoArgentineanArmenianAssyrian/Chaldean/SyriacAustralianAustrianBahamianBangladeshiBarbadianBasqueBelgianBelizeanBermudanBhutaneseBlackfeetBolivianBrazilianBritishBritish West IndianBulgarianBurmeseCajunCambodianCanadianCape VerdeanCarpatho RusynCelticCentral AmericanCentral American IndianCherokeeCheyenneChickasawChileanChineseChippewaChoctawColombianColvilleComancheCosta RicanCreeCreekCroatianCrowCubanCypriotCzechCzechoslovakianDanishDelawareDominicanDutchDutch West IndianEastern EuropeanEcuadorianEgyptianEnglishEstonianEthiopianEuropeanFijianFilipinoFinnishFrenchFrench American IndianFrench CanadianGermanGerman RussianGhanaianGreekGuamanian/ChamorroGuatemalanGuyaneseHaitianHmongHonduranHopiHoumaHungarianIcelanderIndian (Asian)IndonesianInupiatIranianIraqiIrishIroquoisIsraeliItalianJamaicanJapaneseJordanianKenyanKiowaKoreanLaotianLatvianLebaneseLiberianLithuanianLumbeeLuxembourgerMacedonianMalaysianMalteseMarshalleseMenomineeMexicanMexican American IndianMongolianMoroccanNative HawaiianNavajoNepaleseNew ZealanderNicaraguanNigerianNorthern EuropeanNorwegianOkinawanOsageOttawaPaiutePalestinianPanamanianParaguayanPennsylvania GermanPeruvianPimaPolishPortuguesePotawatomiPuebloPuerto RicanPuget Sound SalishRomanianRussianSalvadoranSamoanScandinavianScotch-IrishScottishSeminoleSenegaleseSerbianShoshoneSierra LeoneanSiouxSlavicSlovakSloveneSomaliSouth AfricanSouth AmericanSouth American IndianSoviet UnionSpaniardSpanishSpanish AmericanSpanish American IndianSri LankanSubsaharan AfricanSudaneseSwedishSwissSyrianTaiwaneseThaiTlingit-HaidaTohono O'OdhamTonganTrinidadian and TobagonianTsimshianTurkishU.S. Virgin IslanderUgandanUkrainianUruguayanUteVenezuelanVietnameseWelshWest IndianYakamaYaquiYugoslavianYumanYup'ikZimbabwean
Immigration
NonimmigrantsImmigrantsAfghanistanAfricaAlbaniaArgentinaArmeniaAsiaAustraliaAustriaBahamasBangladeshBarbadosBelarusBelgiumBelizeBoliviaBosnia and HerzegovinaBrazilBulgariaBurma/MyanmarCabo VerdeCambodiaCameroonCanadaCaribbeanCentral AmericaChileChinaColombiaCongoCosta RicaCroatiaCubaCzechoslovakiaDenmarkDominicaDominican RepublicEastern AfricaEastern AsiaEastern EuropeEcuadorEgyptEl SalvadorEnglandEritreaEthiopiaEuropeFijiFranceGermanyGhanaGreeceGrenadaGuatemalaGuyanaHaitiHondurasHong KongHungaryIndiaIndonesiaIranIraqIrelandIsraelItalyJamaicaJapanJordanKazakhstanKenyaKoreaKuwaitLaosLatin AmericaLatviaLebanonLiberiaLithuaniaMalaysiaMexicoMicronesiaMiddle AfricaMoldovaMoroccoNepalNetherlandsNicaraguaNigeriaNorth AmericaNorth MacedoniaNorthern AfricaNorthern EuropeNorwayOceaniaPakistanPanamaPeruPhilippinesPolandPortugalRomaniaRussiaSaudi ArabiaScotlandSenegalSerbiaSierra LeoneSingaporeSomaliaSouth AfricaSouth AmericaSouth Central AsiaSouth Eastern AsiaSouthern EuropeSpainSri LankaSt. Vincent and the GrenadinesSudanSwedenSwitzerlandSyriaTaiwanThailandTrinidad and TobagoTurkeyUgandaUkraineUruguayUzbekistanVenezuelaVietnamWest IndiesWestern AfricaWestern AsiaWestern EuropeYemenZaireZimbabweAzores
Pakistani
Race
Ancestry
AfghanAfricanAlaska NativeAlaskan AthabascanAlbanianAleutAlsatianAmericanApacheArabArapahoArgentineanArmenianAssyrian/Chaldean/SyriacAustralianAustrianBahamianBangladeshiBarbadianBasqueBelgianBelizeanBermudanBhutaneseBlackfeetBolivianBrazilianBritishBritish West IndianBulgarianBurmeseCajunCambodianCanadianCape VerdeanCarpatho RusynCelticCentral AmericanCentral American IndianCherokeeCheyenneChickasawChileanChineseChippewaChoctawColombianColvilleComancheCosta RicanCreeCreekCroatianCrowCubanCypriotCzechCzechoslovakianDanishDelawareDominicanDutchDutch West IndianEastern EuropeanEcuadorianEgyptianEnglishEstonianEthiopianEuropeanFijianFilipinoFinnishFrenchFrench American IndianFrench CanadianGermanGerman RussianGhanaianGreekGuamanian/ChamorroGuatemalanGuyaneseHaitianHmongHonduranHopiHoumaHungarianIcelanderIndian (Asian)IndonesianInupiatIranianIraqiIrishIroquoisIsraeliItalianJamaicanJapaneseJordanianKenyanKiowaKoreanLaotianLatvianLebaneseLiberianLithuanianLumbeeLuxembourgerMacedonianMalaysianMalteseMarshalleseMenomineeMexicanMexican American IndianMongolianMoroccanNative HawaiianNavajoNepaleseNew ZealanderNicaraguanNigerianNorthern EuropeanNorwegianOkinawanOsageOttawaPaiutePakistaniPalestinianPanamanianParaguayanPennsylvania GermanPeruvianPimaPolishPortuguesePotawatomiPuebloPuerto RicanPuget Sound SalishRomanianRussianSalvadoranSamoanScandinavianScotch-IrishScottishSeminoleSenegaleseSerbianShoshoneSierra LeoneanSiouxSlavicSlovakSloveneSomaliSouth AfricanSouth AmericanSouth American IndianSoviet UnionSpaniardSpanishSpanish AmericanSpanish American IndianSri LankanSubsaharan AfricanSudaneseSwedishSwissSyrianTaiwaneseThaiTlingit-HaidaTohono O'OdhamTonganTrinidadian and TobagonianTsimshianTurkishU.S. Virgin IslanderUgandanUkrainianUruguayanUteVenezuelanVietnameseWelshWest IndianYakamaYaquiYugoslavianYumanYup'ikZimbabwean
Immigration
NonimmigrantsImmigrantsAfghanistanAfricaAlbaniaArgentinaArmeniaAsiaAustraliaAustriaBahamasBangladeshBarbadosBelarusBelgiumBelizeBoliviaBosnia and HerzegovinaBrazilBulgariaBurma/MyanmarCabo VerdeCambodiaCameroonCanadaCaribbeanCentral AmericaChileChinaColombiaCongoCosta RicaCroatiaCubaCzechoslovakiaDenmarkDominicaDominican RepublicEastern AsiaEastern EuropeEcuadorEgyptEl SalvadorEnglandEritreaEthiopiaEuropeFijiFranceGermanyGhanaGreeceGrenadaGuatemalaGuyanaHaitiHondurasHong KongHungaryIndiaIndonesiaIranIraqIrelandIsraelItalyJamaicaJapanJordanKazakhstanKenyaKoreaKuwaitLaosLatin AmericaLatviaLebanonLiberiaLithuaniaMalaysiaMexicoMicronesiaMiddle AfricaMoldovaMoroccoNepalNetherlandsNicaraguaNigeriaNorth AmericaNorth MacedoniaNorthern AfricaNorthern EuropeNorwayOceaniaPakistanPanamaPeruPhilippinesPolandPortugalRomaniaRussiaSaudi ArabiaScotlandSenegalSerbiaSierra LeoneSingaporeSomaliaSouth AfricaSouth AmericaSouth Central AsiaSouth Eastern AsiaSouthern EuropeSpainSri LankaSt. Vincent and the GrenadinesSudanSwedenSwitzerlandSyriaTaiwanThailandTrinidad and TobagoTurkeyUgandaUkraineUruguayUzbekistanVenezuelaVietnamWest IndiesWestern AfricaWestern AsiaWestern EuropeYemenZaireZimbabweAzores
Seniors Poverty Over the Age of 75
Income
Poverty
Unemployment
Labor Participation
Family Structure
Vehicle Availability
Education Level
Disability

Seniors Poverty Over the Age of 75 Comparison

Immigrants from Eastern Africa

Pakistanis

Good
Excellent
12.1%
SENIORS POVERTY OVER THE AGE OF 75
60.9/ 100
METRIC RATING
160th/ 347
METRIC RANK
11.8%
SENIORS POVERTY OVER THE AGE OF 75
84.0/ 100
METRIC RATING
122nd/ 347
METRIC RANK

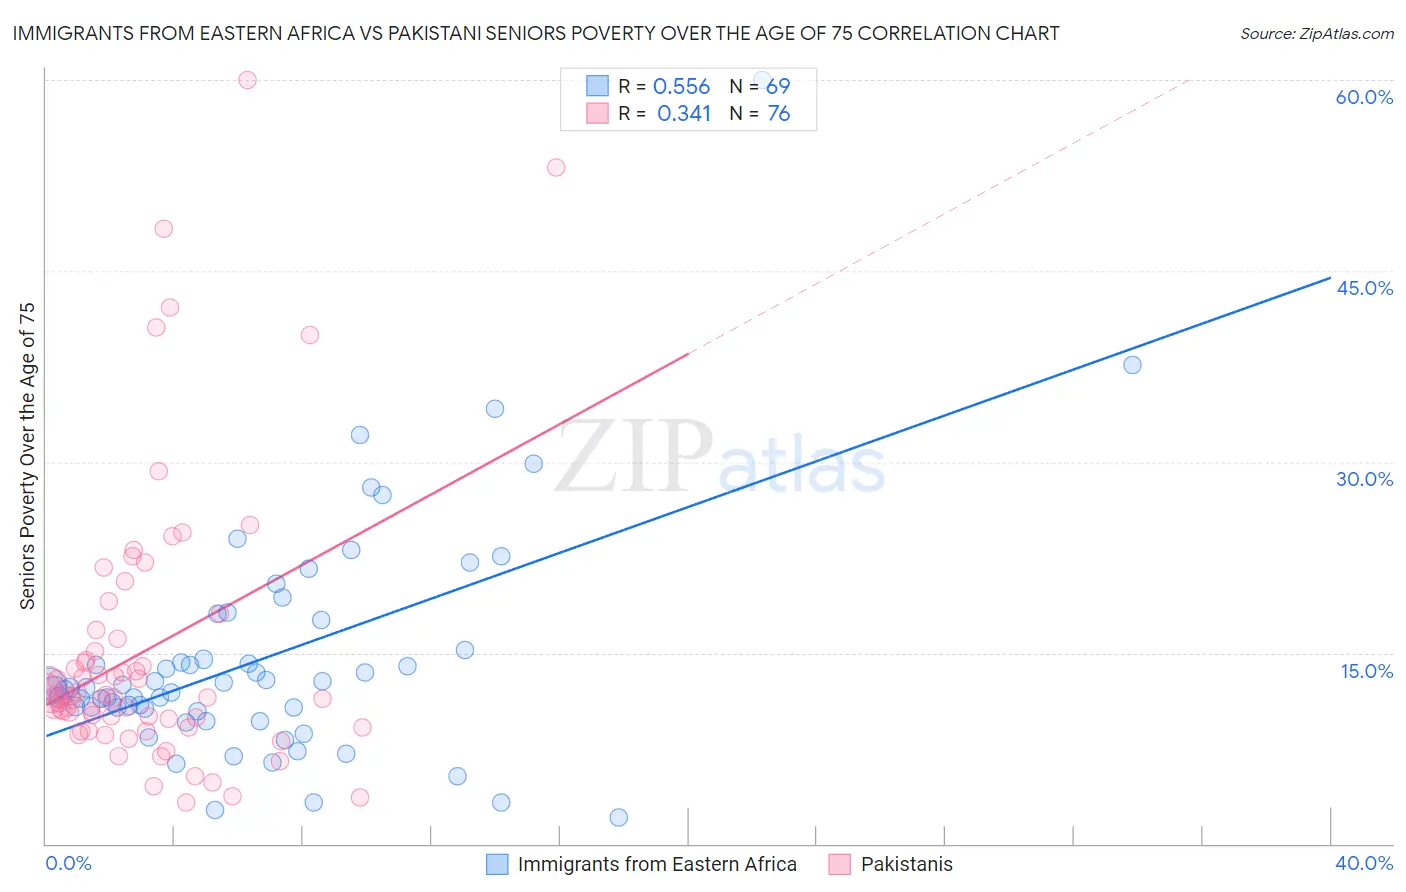
Immigrants from Eastern Africa vs Pakistani Seniors Poverty Over the Age of 75 Correlation Chart

The statistical analysis conducted on geographies consisting of 351,649,157 people shows a substantial positive correlation between the proportion of Immigrants from Eastern Africa and poverty level among seniors over the age of 75 in the United States with a correlation coefficient (R) of 0.556 and weighted average of 12.1%. Similarly, the statistical analysis conducted on geographies consisting of 332,247,947 people shows a mild positive correlation between the proportion of Pakistanis and poverty level among seniors over the age of 75 in the United States with a correlation coefficient (R) of 0.341 and weighted average of 11.8%, a difference of 2.6%.
Immigrants from Eastern Africa vs Pakistani Seniors Poverty Over the Age of 75

Seniors Poverty Over the Age of 75 Correlation Summary

MeasurementImmigrants from Eastern AfricaPakistani
Minimum2.1%3.3%
Maximum60.0%60.0%
Range57.9%56.7%
Mean14.5%15.1%
Median12.3%11.6%
Interquartile 25% (IQ1)10.5%9.4%
Interquartile 75% (IQ3)16.4%15.6%
Interquartile Range (IQR)5.9%6.1%
Standard Deviation (Sample)9.1%11.0%
Standard Deviation (Population)9.1%11.0%

Similar Demographics by Seniors Poverty Over the Age of 75

Demographics Similar to Immigrants from Eastern Africa by Seniors Poverty Over the Age of 75

In terms of seniors poverty over the age of 75, the demographic groups most similar to Immigrants from Eastern Africa are Immigrants from Norway (12.1%, a difference of 0.020%), Portuguese (12.1%, a difference of 0.030%), Immigrants from Middle Africa (12.1%, a difference of 0.030%), Immigrants from Serbia (12.1%, a difference of 0.050%), and Immigrants from Sudan (12.1%, a difference of 0.070%).
DemographicsRating | RankSeniors Poverty Over the Age of 75
Immigrants | Turkey
64.7
/100
|
#153
Good
12.0%
Cambodians
64.0
/100
|
#154
Good
12.0%
Indonesians
62.6
/100
|
#155
Good
12.1%
Immigrants | Burma/Myanmar
62.3
/100
|
#156
Good
12.1%
Immigrants | Sudan
61.7
/100
|
#157
Good
12.1%
Portuguese
61.3
/100
|
#158
Good
12.1%
Immigrants | Middle Africa
61.2
/100
|
#159
Good
12.1%
Immigrants | Eastern Africa
60.9
/100
|
#160
Good
12.1%
Immigrants | Norway
60.6
/100
|
#161
Good
12.1%
Immigrants | Serbia
60.2
/100
|
#162
Good
12.1%
Immigrants | Greece
58.2
/100
|
#163
Average
12.1%
Potawatomi
57.4
/100
|
#164
Average
12.1%
Okinawans
56.3
/100
|
#165
Average
12.1%
Egyptians
54.8
/100
|
#166
Average
12.1%
Immigrants | Switzerland
54.5
/100
|
#167
Average
12.1%

Demographics Similar to Pakistanis by Seniors Poverty Over the Age of 75

In terms of seniors poverty over the age of 75, the demographic groups most similar to Pakistanis are Immigrants from Italy (11.8%, a difference of 0.0%), Malaysian (11.8%, a difference of 0.010%), Fijian (11.8%, a difference of 0.030%), Sudanese (11.8%, a difference of 0.060%), and Immigrants from Nepal (11.8%, a difference of 0.080%).
DemographicsRating | RankSeniors Poverty Over the Age of 75
New Zealanders
86.3
/100
|
#115
Excellent
11.7%
Iraqis
86.3
/100
|
#116
Excellent
11.7%
Icelanders
85.7
/100
|
#117
Excellent
11.7%
Immigrants | Zimbabwe
85.5
/100
|
#118
Excellent
11.7%
Immigrants | Uganda
84.8
/100
|
#119
Excellent
11.8%
Immigrants | Nepal
84.5
/100
|
#120
Excellent
11.8%
Malaysians
84.1
/100
|
#121
Excellent
11.8%
Pakistanis
84.0
/100
|
#122
Excellent
11.8%
Immigrants | Italy
84.0
/100
|
#123
Excellent
11.8%
Fijians
83.8
/100
|
#124
Excellent
11.8%
Sudanese
83.6
/100
|
#125
Excellent
11.8%
Pennsylvania Germans
83.4
/100
|
#126
Excellent
11.8%
Immigrants | Denmark
82.6
/100
|
#127
Excellent
11.8%
Immigrants | Hungary
81.7
/100
|
#128
Excellent
11.8%
Ethiopians
80.7
/100
|
#129
Excellent
11.8%