Immigrants from Eastern Africa vs Immigrants from Burma/Myanmar Child Poverty Among Boys Under 16

COMPARE

Immigrants from Eastern Africa
Race
Ancestry
AfghanAfricanAlaska NativeAlaskan AthabascanAlbanianAleutAlsatianAmericanApacheArabArapahoArgentineanArmenianAssyrian/Chaldean/SyriacAustralianAustrianBahamianBangladeshiBarbadianBasqueBelgianBelizeanBermudanBhutaneseBlackfeetBolivianBrazilianBritishBritish West IndianBulgarianBurmeseCajunCambodianCanadianCape VerdeanCarpatho RusynCelticCentral AmericanCentral American IndianCherokeeCheyenneChickasawChileanChineseChippewaChoctawColombianColvilleComancheCosta RicanCreeCreekCroatianCrowCubanCypriotCzechCzechoslovakianDanishDelawareDominicanDutchDutch West IndianEastern EuropeanEcuadorianEgyptianEnglishEstonianEthiopianEuropeanFijianFilipinoFinnishFrenchFrench American IndianFrench CanadianGermanGerman RussianGhanaianGreekGuamanian/ChamorroGuatemalanGuyaneseHaitianHmongHonduranHopiHoumaHungarianIcelanderIndian (Asian)IndonesianInupiatIranianIraqiIrishIroquoisIsraeliItalianJamaicanJapaneseJordanianKenyanKiowaKoreanLaotianLatvianLebaneseLiberianLithuanianLumbeeLuxembourgerMacedonianMalaysianMalteseMarshalleseMenomineeMexicanMexican American IndianMongolianMoroccanNative HawaiianNavajoNepaleseNew ZealanderNicaraguanNigerianNorthern EuropeanNorwegianOkinawanOsageOttawaPaiutePakistaniPalestinianPanamanianParaguayanPennsylvania GermanPeruvianPimaPolishPortuguesePotawatomiPuebloPuerto RicanPuget Sound SalishRomanianRussianSalvadoranSamoanScandinavianScotch-IrishScottishSeminoleSenegaleseSerbianShoshoneSierra LeoneanSiouxSlavicSlovakSloveneSomaliSouth AfricanSouth AmericanSouth American IndianSoviet UnionSpaniardSpanishSpanish AmericanSpanish American IndianSri LankanSubsaharan AfricanSudaneseSwedishSwissSyrianTaiwaneseThaiTlingit-HaidaTohono O'OdhamTonganTrinidadian and TobagonianTsimshianTurkishU.S. Virgin IslanderUgandanUkrainianUruguayanUteVenezuelanVietnameseWelshWest IndianYakamaYaquiYugoslavianYumanYup'ikZimbabwean
Immigration
NonimmigrantsImmigrantsAfghanistanAfricaAlbaniaArgentinaArmeniaAsiaAustraliaAustriaBahamasBangladeshBarbadosBelarusBelgiumBelizeBoliviaBosnia and HerzegovinaBrazilBulgariaCabo VerdeCambodiaCameroonCanadaCaribbeanCentral AmericaChileChinaColombiaCongoCosta RicaCroatiaCubaCzechoslovakiaDenmarkDominicaDominican RepublicEastern AfricaEastern AsiaEastern EuropeEcuadorEgyptEl SalvadorEnglandEritreaEthiopiaEuropeFijiFranceGermanyGhanaGreeceGrenadaGuatemalaGuyanaHaitiHondurasHong KongHungaryIndiaIndonesiaIranIraqIrelandIsraelItalyJamaicaJapanJordanKazakhstanKenyaKoreaKuwaitLaosLatin AmericaLatviaLebanonLiberiaLithuaniaMalaysiaMexicoMicronesiaMiddle AfricaMoldovaMoroccoNepalNetherlandsNicaraguaNigeriaNorth AmericaNorth MacedoniaNorthern AfricaNorthern EuropeNorwayOceaniaPakistanPanamaPeruPhilippinesPolandPortugalRomaniaRussiaSaudi ArabiaScotlandSenegalSerbiaSierra LeoneSingaporeSomaliaSouth AfricaSouth AmericaSouth Central AsiaSouth Eastern AsiaSouthern EuropeSpainSri LankaSt. Vincent and the GrenadinesSudanSwedenSwitzerlandSyriaTaiwanThailandTrinidad and TobagoTurkeyUgandaUkraineUruguayUzbekistanVenezuelaVietnamWest IndiesWestern AfricaWestern AsiaWestern EuropeYemenZaireZimbabweAzores
Immigrants from Burma/Myanmar
Race
Ancestry
AfghanAfricanAlaska NativeAlaskan AthabascanAlbanianAleutAlsatianAmericanApacheArabArapahoArgentineanArmenianAssyrian/Chaldean/SyriacAustralianAustrianBahamianBangladeshiBarbadianBasqueBelgianBelizeanBermudanBhutaneseBlackfeetBolivianBrazilianBritishBritish West IndianBulgarianBurmeseCajunCambodianCanadianCape VerdeanCarpatho RusynCelticCentral AmericanCentral American IndianCherokeeCheyenneChickasawChileanChineseChippewaChoctawColombianColvilleComancheCosta RicanCreeCreekCroatianCrowCubanCypriotCzechCzechoslovakianDanishDelawareDominicanDutchDutch West IndianEastern EuropeanEcuadorianEgyptianEnglishEstonianEthiopianEuropeanFijianFilipinoFinnishFrenchFrench American IndianFrench CanadianGermanGerman RussianGhanaianGreekGuamanian/ChamorroGuatemalanGuyaneseHaitianHmongHonduranHopiHoumaHungarianIcelanderIndian (Asian)IndonesianInupiatIranianIraqiIrishIroquoisIsraeliItalianJamaicanJapaneseJordanianKenyanKiowaKoreanLaotianLatvianLebaneseLiberianLithuanianLumbeeLuxembourgerMacedonianMalaysianMalteseMarshalleseMenomineeMexicanMexican American IndianMongolianMoroccanNative HawaiianNavajoNepaleseNew ZealanderNicaraguanNigerianNorthern EuropeanNorwegianOkinawanOsageOttawaPaiutePakistaniPalestinianPanamanianParaguayanPennsylvania GermanPeruvianPimaPolishPortuguesePotawatomiPuebloPuerto RicanPuget Sound SalishRomanianRussianSalvadoranSamoanScandinavianScotch-IrishScottishSeminoleSenegaleseSerbianShoshoneSierra LeoneanSiouxSlavicSlovakSloveneSomaliSouth AfricanSouth AmericanSouth American IndianSoviet UnionSpaniardSpanishSpanish AmericanSpanish American IndianSri LankanSubsaharan AfricanSudaneseSwedishSwissSyrianTaiwaneseThaiTlingit-HaidaTohono O'OdhamTonganTrinidadian and TobagonianTsimshianTurkishU.S. Virgin IslanderUgandanUkrainianUruguayanUteVenezuelanVietnameseWelshWest IndianYakamaYaquiYugoslavianYumanYup'ikZimbabwean
Immigration
NonimmigrantsImmigrantsAfghanistanAfricaAlbaniaArgentinaArmeniaAsiaAustraliaAustriaBahamasBangladeshBarbadosBelarusBelgiumBelizeBoliviaBosnia and HerzegovinaBrazilBulgariaBurma/MyanmarCabo VerdeCambodiaCameroonCanadaCaribbeanCentral AmericaChileChinaColombiaCongoCosta RicaCroatiaCubaCzechoslovakiaDenmarkDominicaDominican RepublicEastern AsiaEastern EuropeEcuadorEgyptEl SalvadorEnglandEritreaEthiopiaEuropeFijiFranceGermanyGhanaGreeceGrenadaGuatemalaGuyanaHaitiHondurasHong KongHungaryIndiaIndonesiaIranIraqIrelandIsraelItalyJamaicaJapanJordanKazakhstanKenyaKoreaKuwaitLaosLatin AmericaLatviaLebanonLiberiaLithuaniaMalaysiaMexicoMicronesiaMiddle AfricaMoldovaMoroccoNepalNetherlandsNicaraguaNigeriaNorth AmericaNorth MacedoniaNorthern AfricaNorthern EuropeNorwayOceaniaPakistanPanamaPeruPhilippinesPolandPortugalRomaniaRussiaSaudi ArabiaScotlandSenegalSerbiaSierra LeoneSingaporeSomaliaSouth AfricaSouth AmericaSouth Central AsiaSouth Eastern AsiaSouthern EuropeSpainSri LankaSt. Vincent and the GrenadinesSudanSwedenSwitzerlandSyriaTaiwanThailandTrinidad and TobagoTurkeyUgandaUkraineUruguayUzbekistanVenezuelaVietnamWest IndiesWestern AfricaWestern AsiaWestern EuropeYemenZaireZimbabweAzores
Child Poverty Among Boys Under 16
Income
Poverty
Unemployment
Labor Participation
Family Structure
Vehicle Availability
Education Level
Disability

Child Poverty Among Boys Under 16 Comparison

Immigrants from Eastern Africa

Immigrants from Burma/Myanmar

Tragic
Tragic
17.7%
CHILD POVERTY AMONG BOYS UNDER 16
6.0/ 100
METRIC RATING
213th/ 347
METRIC RANK
19.2%
CHILD POVERTY AMONG BOYS UNDER 16
0.2/ 100
METRIC RATING
250th/ 347
METRIC RANK

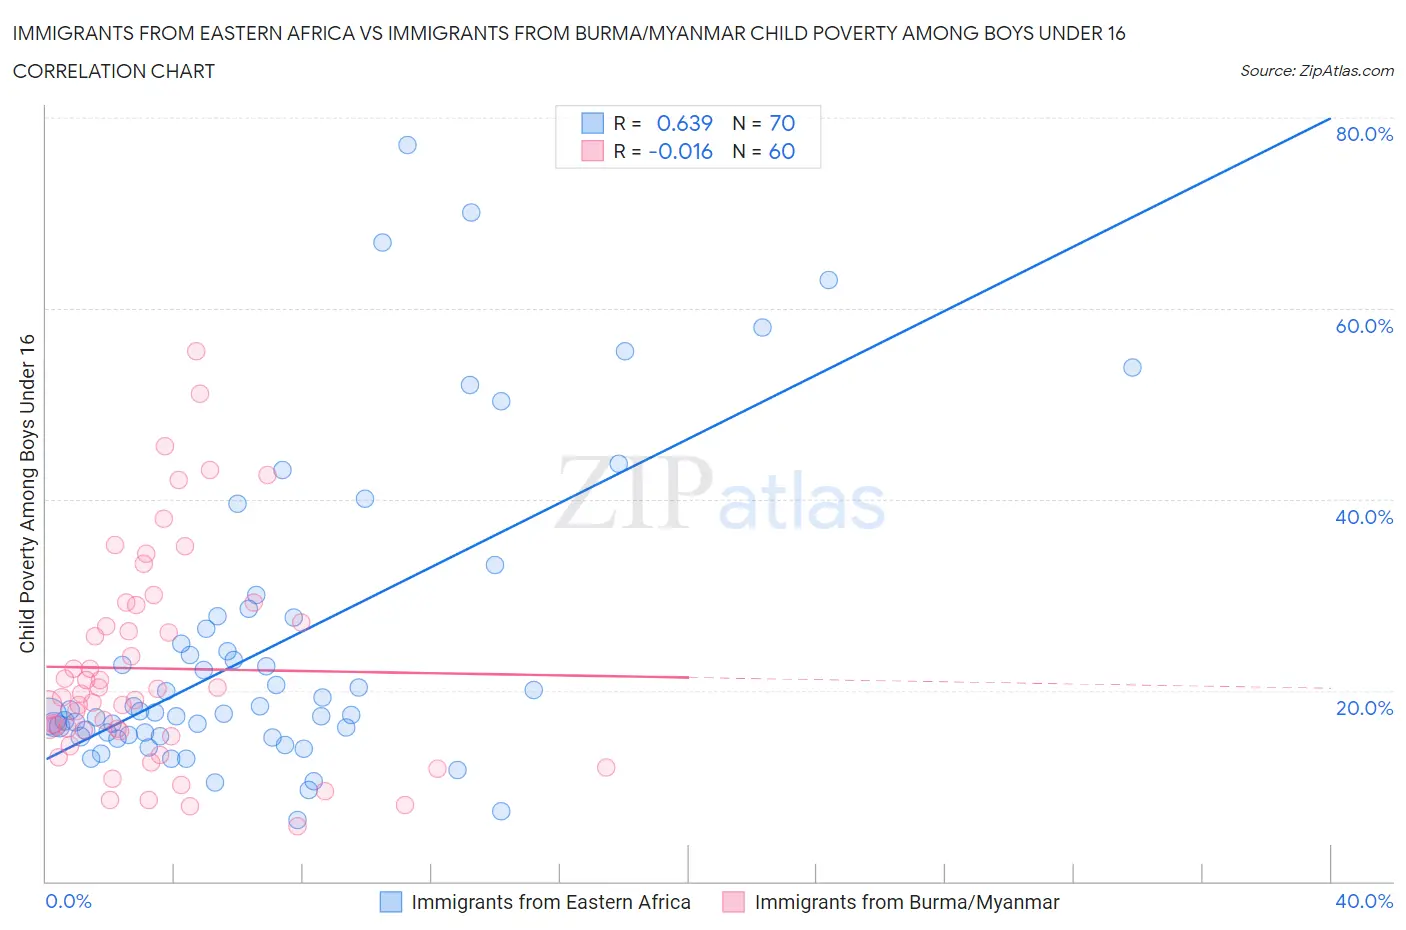
Immigrants from Eastern Africa vs Immigrants from Burma/Myanmar Child Poverty Among Boys Under 16 Correlation Chart

The statistical analysis conducted on geographies consisting of 350,926,284 people shows a significant positive correlation between the proportion of Immigrants from Eastern Africa and poverty level among boys under the age of 16 in the United States with a correlation coefficient (R) of 0.639 and weighted average of 17.7%. Similarly, the statistical analysis conducted on geographies consisting of 171,312,053 people shows no correlation between the proportion of Immigrants from Burma/Myanmar and poverty level among boys under the age of 16 in the United States with a correlation coefficient (R) of -0.016 and weighted average of 19.2%, a difference of 8.5%.
Immigrants from Eastern Africa vs Immigrants from Burma/Myanmar Child Poverty Among Boys Under 16

Child Poverty Among Boys Under 16 Correlation Summary

MeasurementImmigrants from Eastern AfricaImmigrants from Burma/Myanmar
Minimum6.5%5.8%
Maximum77.2%55.6%
Range70.7%49.8%
Mean24.7%22.3%
Median17.7%19.5%
Interquartile 25% (IQ1)15.3%15.4%
Interquartile 75% (IQ3)27.6%28.0%
Interquartile Range (IQR)12.3%12.6%
Standard Deviation (Sample)16.1%11.2%
Standard Deviation (Population)16.0%11.1%

Similar Demographics by Child Poverty Among Boys Under 16

Demographics Similar to Immigrants from Eastern Africa by Child Poverty Among Boys Under 16

In terms of child poverty among boys under 16, the demographic groups most similar to Immigrants from Eastern Africa are Panamanian (17.7%, a difference of 0.0%), Osage (17.7%, a difference of 0.080%), Moroccan (17.7%, a difference of 0.17%), Japanese (17.7%, a difference of 0.20%), and Iraqi (17.7%, a difference of 0.22%).
DemographicsRating | RankChild Poverty Among Boys Under 16
German Russians
10.9
/100
|
#206
Poor
17.4%
Immigrants | Thailand
8.2
/100
|
#207
Tragic
17.5%
Malaysians
7.6
/100
|
#208
Tragic
17.6%
Alaskan Athabascans
7.3
/100
|
#209
Tragic
17.6%
Immigrants | Armenia
6.8
/100
|
#210
Tragic
17.6%
Immigrants | Immigrants
6.7
/100
|
#211
Tragic
17.6%
Aleuts
6.6
/100
|
#212
Tragic
17.7%
Immigrants | Eastern Africa
6.0
/100
|
#213
Tragic
17.7%
Panamanians
5.9
/100
|
#214
Tragic
17.7%
Osage
5.8
/100
|
#215
Tragic
17.7%
Moroccans
5.6
/100
|
#216
Tragic
17.7%
Japanese
5.5
/100
|
#217
Tragic
17.7%
Iraqis
5.5
/100
|
#218
Tragic
17.7%
Sierra Leoneans
5.3
/100
|
#219
Tragic
17.8%
Immigrants | Cambodia
5.1
/100
|
#220
Tragic
17.8%

Demographics Similar to Immigrants from Burma/Myanmar by Child Poverty Among Boys Under 16

In terms of child poverty among boys under 16, the demographic groups most similar to Immigrants from Burma/Myanmar are French American Indian (19.2%, a difference of 0.030%), Immigrants from Western Africa (19.3%, a difference of 0.26%), Liberian (19.3%, a difference of 0.33%), Trinidadian and Tobagonian (19.3%, a difference of 0.60%), and Ecuadorian (19.3%, a difference of 0.60%).
DemographicsRating | RankChild Poverty Among Boys Under 16
Immigrants | Azores
0.4
/100
|
#243
Tragic
18.9%
Immigrants | Middle Africa
0.4
/100
|
#244
Tragic
18.9%
Cree
0.4
/100
|
#245
Tragic
19.0%
Immigrants | Nicaragua
0.4
/100
|
#246
Tragic
19.0%
Immigrants | Trinidad and Tobago
0.3
/100
|
#247
Tragic
19.0%
Salvadorans
0.3
/100
|
#248
Tragic
19.0%
Alsatians
0.3
/100
|
#249
Tragic
19.1%
Immigrants | Burma/Myanmar
0.2
/100
|
#250
Tragic
19.2%
French American Indians
0.2
/100
|
#251
Tragic
19.2%
Immigrants | Western Africa
0.2
/100
|
#252
Tragic
19.3%
Liberians
0.2
/100
|
#253
Tragic
19.3%
Trinidadians and Tobagonians
0.2
/100
|
#254
Tragic
19.3%
Ecuadorians
0.2
/100
|
#255
Tragic
19.3%
Immigrants | Liberia
0.2
/100
|
#256
Tragic
19.3%
Mexican American Indians
0.2
/100
|
#257
Tragic
19.4%