Immigrants from Congo vs Immigrants from Barbados Seniors Poverty Over the Age of 75

COMPARE

Immigrants from Congo
Race
Ancestry
AfghanAfricanAlaska NativeAlaskan AthabascanAlbanianAleutAlsatianAmericanApacheArabArapahoArgentineanArmenianAssyrian/Chaldean/SyriacAustralianAustrianBahamianBangladeshiBarbadianBasqueBelgianBelizeanBermudanBhutaneseBlackfeetBolivianBrazilianBritishBritish West IndianBulgarianBurmeseCajunCambodianCanadianCape VerdeanCarpatho RusynCelticCentral AmericanCentral American IndianCherokeeCheyenneChickasawChileanChineseChippewaChoctawColombianColvilleComancheCosta RicanCreeCreekCroatianCrowCubanCypriotCzechCzechoslovakianDanishDelawareDominicanDutchDutch West IndianEastern EuropeanEcuadorianEgyptianEnglishEstonianEthiopianEuropeanFijianFilipinoFinnishFrenchFrench American IndianFrench CanadianGermanGerman RussianGhanaianGreekGuamanian/ChamorroGuatemalanGuyaneseHaitianHmongHonduranHopiHoumaHungarianIcelanderIndian (Asian)IndonesianInupiatIranianIraqiIrishIroquoisIsraeliItalianJamaicanJapaneseJordanianKenyanKiowaKoreanLaotianLatvianLebaneseLiberianLithuanianLumbeeLuxembourgerMacedonianMalaysianMalteseMarshalleseMenomineeMexicanMexican American IndianMongolianMoroccanNative HawaiianNavajoNepaleseNew ZealanderNicaraguanNigerianNorthern EuropeanNorwegianOkinawanOsageOttawaPaiutePakistaniPalestinianPanamanianParaguayanPennsylvania GermanPeruvianPimaPolishPortuguesePotawatomiPuebloPuerto RicanPuget Sound SalishRomanianRussianSalvadoranSamoanScandinavianScotch-IrishScottishSeminoleSenegaleseSerbianShoshoneSierra LeoneanSiouxSlavicSlovakSloveneSomaliSouth AfricanSouth AmericanSouth American IndianSoviet UnionSpaniardSpanishSpanish AmericanSpanish American IndianSri LankanSubsaharan AfricanSudaneseSwedishSwissSyrianTaiwaneseThaiTlingit-HaidaTohono O'OdhamTonganTrinidadian and TobagonianTsimshianTurkishU.S. Virgin IslanderUgandanUkrainianUruguayanUteVenezuelanVietnameseWelshWest IndianYakamaYaquiYugoslavianYumanYup'ikZimbabwean
Immigration
NonimmigrantsImmigrantsAfghanistanAfricaAlbaniaArgentinaArmeniaAsiaAustraliaAustriaBahamasBangladeshBelarusBelgiumBelizeBoliviaBosnia and HerzegovinaBrazilBulgariaBurma/MyanmarCabo VerdeCambodiaCameroonCanadaCaribbeanCentral AmericaChileChinaColombiaCongoCosta RicaCroatiaCubaCzechoslovakiaDenmarkDominicaDominican RepublicEastern AfricaEastern AsiaEastern EuropeEcuadorEgyptEl SalvadorEnglandEritreaEthiopiaEuropeFijiFranceGermanyGhanaGreeceGrenadaGuatemalaGuyanaHaitiHondurasHong KongHungaryIndiaIndonesiaIranIraqIrelandIsraelItalyJamaicaJapanJordanKazakhstanKenyaKoreaKuwaitLaosLatin AmericaLatviaLebanonLiberiaLithuaniaMalaysiaMexicoMicronesiaMiddle AfricaMoldovaMoroccoNepalNetherlandsNicaraguaNigeriaNorth AmericaNorth MacedoniaNorthern AfricaNorthern EuropeNorwayOceaniaPakistanPanamaPeruPhilippinesPolandPortugalRomaniaRussiaSaudi ArabiaScotlandSenegalSerbiaSierra LeoneSingaporeSomaliaSouth AfricaSouth AmericaSouth Central AsiaSouth Eastern AsiaSouthern EuropeSpainSri LankaSt. Vincent and the GrenadinesSudanSwedenSwitzerlandSyriaTaiwanThailandTrinidad and TobagoTurkeyUgandaUkraineUruguayUzbekistanVenezuelaVietnamWest IndiesWestern AfricaWestern AsiaWestern EuropeYemenZaireZimbabweAzores
Immigrants from Barbados
Race
Ancestry
AfghanAfricanAlaska NativeAlaskan AthabascanAlbanianAleutAlsatianAmericanApacheArabArapahoArgentineanArmenianAssyrian/Chaldean/SyriacAustralianAustrianBahamianBangladeshiBarbadianBasqueBelgianBelizeanBermudanBhutaneseBlackfeetBolivianBrazilianBritishBritish West IndianBulgarianBurmeseCajunCambodianCanadianCape VerdeanCarpatho RusynCelticCentral AmericanCentral American IndianCherokeeCheyenneChickasawChileanChineseChippewaChoctawColombianColvilleComancheCosta RicanCreeCreekCroatianCrowCubanCypriotCzechCzechoslovakianDanishDelawareDominicanDutchDutch West IndianEastern EuropeanEcuadorianEgyptianEnglishEstonianEthiopianEuropeanFijianFilipinoFinnishFrenchFrench American IndianFrench CanadianGermanGerman RussianGhanaianGreekGuamanian/ChamorroGuatemalanGuyaneseHaitianHmongHonduranHopiHoumaHungarianIcelanderIndian (Asian)IndonesianInupiatIranianIraqiIrishIroquoisIsraeliItalianJamaicanJapaneseJordanianKenyanKiowaKoreanLaotianLatvianLebaneseLiberianLithuanianLumbeeLuxembourgerMacedonianMalaysianMalteseMarshalleseMenomineeMexicanMexican American IndianMongolianMoroccanNative HawaiianNavajoNepaleseNew ZealanderNicaraguanNigerianNorthern EuropeanNorwegianOkinawanOsageOttawaPaiutePakistaniPalestinianPanamanianParaguayanPennsylvania GermanPeruvianPimaPolishPortuguesePotawatomiPuebloPuerto RicanPuget Sound SalishRomanianRussianSalvadoranSamoanScandinavianScotch-IrishScottishSeminoleSenegaleseSerbianShoshoneSierra LeoneanSiouxSlavicSlovakSloveneSomaliSouth AfricanSouth AmericanSouth American IndianSoviet UnionSpaniardSpanishSpanish AmericanSpanish American IndianSri LankanSubsaharan AfricanSudaneseSwedishSwissSyrianTaiwaneseThaiTlingit-HaidaTohono O'OdhamTonganTrinidadian and TobagonianTsimshianTurkishU.S. Virgin IslanderUgandanUkrainianUruguayanUteVenezuelanVietnameseWelshWest IndianYakamaYaquiYugoslavianYumanYup'ikZimbabwean
Immigration
NonimmigrantsImmigrantsAfghanistanAfricaAlbaniaArgentinaArmeniaAsiaAustraliaAustriaBahamasBangladeshBarbadosBelarusBelgiumBelizeBoliviaBosnia and HerzegovinaBrazilBulgariaBurma/MyanmarCabo VerdeCambodiaCameroonCanadaCaribbeanCentral AmericaChileChinaColombiaCosta RicaCroatiaCubaCzechoslovakiaDenmarkDominicaDominican RepublicEastern AfricaEastern AsiaEastern EuropeEcuadorEgyptEl SalvadorEnglandEritreaEthiopiaEuropeFijiFranceGermanyGhanaGreeceGrenadaGuatemalaGuyanaHaitiHondurasHong KongHungaryIndiaIndonesiaIranIraqIrelandIsraelItalyJamaicaJapanJordanKazakhstanKenyaKoreaKuwaitLaosLatin AmericaLatviaLebanonLiberiaLithuaniaMalaysiaMexicoMicronesiaMiddle AfricaMoldovaMoroccoNepalNetherlandsNicaraguaNigeriaNorth AmericaNorth MacedoniaNorthern AfricaNorthern EuropeNorwayOceaniaPakistanPanamaPeruPhilippinesPolandPortugalRomaniaRussiaSaudi ArabiaScotlandSenegalSerbiaSierra LeoneSingaporeSomaliaSouth AfricaSouth AmericaSouth Central AsiaSouth Eastern AsiaSouthern EuropeSpainSri LankaSt. Vincent and the GrenadinesSudanSwedenSwitzerlandSyriaTaiwanThailandTrinidad and TobagoTurkeyUgandaUkraineUruguayUzbekistanVenezuelaVietnamWest IndiesWestern AfricaWestern AsiaWestern EuropeYemenZaireZimbabweAzores
Seniors Poverty Over the Age of 75
Income
Poverty
Unemployment
Labor Participation
Family Structure
Vehicle Availability
Education Level
Disability

Seniors Poverty Over the Age of 75 Comparison

Immigrants from Congo

Immigrants from Barbados

Fair
Tragic
12.5%
SENIORS POVERTY OVER THE AGE OF 75
23.9/ 100
METRIC RATING
190th/ 347
METRIC RANK
16.5%
SENIORS POVERTY OVER THE AGE OF 75
0.0/ 100
METRIC RATING
322nd/ 347
METRIC RANK

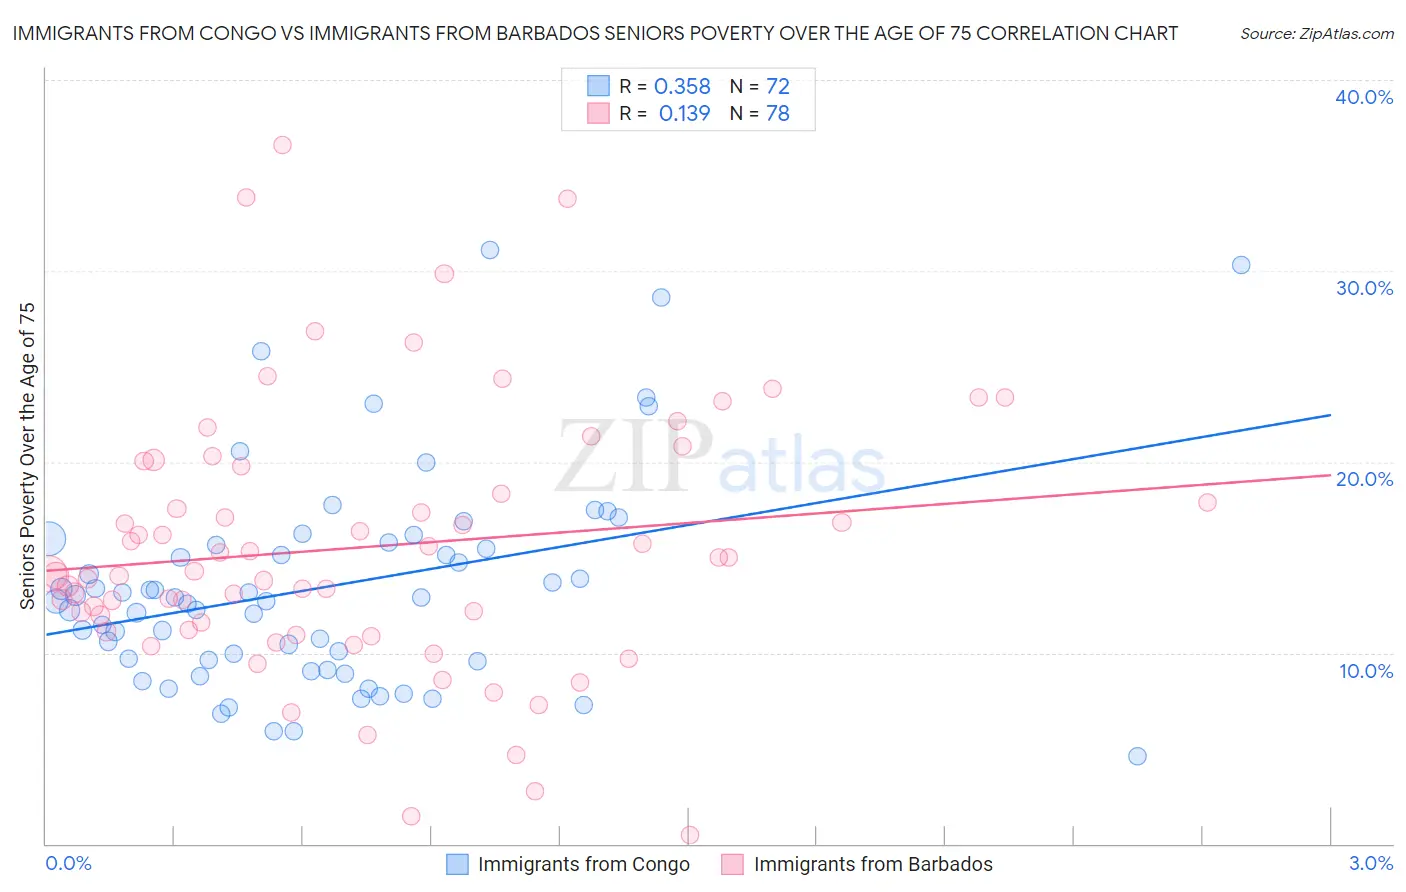
Immigrants from Congo vs Immigrants from Barbados Seniors Poverty Over the Age of 75 Correlation Chart

The statistical analysis conducted on geographies consisting of 91,912,297 people shows a mild positive correlation between the proportion of Immigrants from Congo and poverty level among seniors over the age of 75 in the United States with a correlation coefficient (R) of 0.358 and weighted average of 12.5%. Similarly, the statistical analysis conducted on geographies consisting of 112,407,452 people shows a poor positive correlation between the proportion of Immigrants from Barbados and poverty level among seniors over the age of 75 in the United States with a correlation coefficient (R) of 0.139 and weighted average of 16.5%, a difference of 32.5%.
Immigrants from Congo vs Immigrants from Barbados Seniors Poverty Over the Age of 75

Seniors Poverty Over the Age of 75 Correlation Summary

MeasurementImmigrants from CongoImmigrants from Barbados
Minimum4.6%0.48%
Maximum31.1%36.6%
Range26.5%36.1%
Mean13.5%15.5%
Median12.8%14.2%
Interquartile 25% (IQ1)9.6%11.2%
Interquartile 75% (IQ3)15.7%19.8%
Interquartile Range (IQR)6.1%8.6%
Standard Deviation (Sample)5.6%7.0%
Standard Deviation (Population)5.5%6.9%

Similar Demographics by Seniors Poverty Over the Age of 75

Demographics Similar to Immigrants from Congo by Seniors Poverty Over the Age of 75

In terms of seniors poverty over the age of 75, the demographic groups most similar to Immigrants from Congo are Immigrants from Indonesia (12.5%, a difference of 0.060%), Liberian (12.5%, a difference of 0.070%), Immigrants from Northern Africa (12.5%, a difference of 0.15%), Yaqui (12.5%, a difference of 0.21%), and Choctaw (12.5%, a difference of 0.42%).
DemographicsRating | RankSeniors Poverty Over the Age of 75
Laotians
38.2
/100
|
#183
Fair
12.3%
Kiowa
36.0
/100
|
#184
Fair
12.3%
Immigrants | Malaysia
35.8
/100
|
#185
Fair
12.3%
Sri Lankans
32.3
/100
|
#186
Fair
12.4%
Yaqui
25.9
/100
|
#187
Fair
12.5%
Immigrants | Northern Africa
25.2
/100
|
#188
Fair
12.5%
Immigrants | Indonesia
24.4
/100
|
#189
Fair
12.5%
Immigrants | Congo
23.9
/100
|
#190
Fair
12.5%
Liberians
23.2
/100
|
#191
Fair
12.5%
Choctaw
20.2
/100
|
#192
Fair
12.5%
Taiwanese
17.8
/100
|
#193
Poor
12.6%
Alsatians
17.7
/100
|
#194
Poor
12.6%
Immigrants | France
17.4
/100
|
#195
Poor
12.6%
Immigrants | Eastern Europe
16.0
/100
|
#196
Poor
12.6%
Nepalese
14.4
/100
|
#197
Poor
12.6%

Demographics Similar to Immigrants from Barbados by Seniors Poverty Over the Age of 75

In terms of seniors poverty over the age of 75, the demographic groups most similar to Immigrants from Barbados are Immigrants from Haiti (16.5%, a difference of 0.020%), Central American Indian (16.5%, a difference of 0.090%), Immigrants from Uzbekistan (16.5%, a difference of 0.14%), Immigrants from Yemen (16.5%, a difference of 0.21%), and Nicaraguan (16.6%, a difference of 0.52%).
DemographicsRating | RankSeniors Poverty Over the Age of 75
Guyanese
0.0
/100
|
#315
Tragic
16.1%
Immigrants | Ecuador
0.0
/100
|
#316
Tragic
16.1%
Immigrants | Guyana
0.0
/100
|
#317
Tragic
16.2%
Houma
0.0
/100
|
#318
Tragic
16.2%
Haitians
0.0
/100
|
#319
Tragic
16.2%
Immigrants | Yemen
0.0
/100
|
#320
Tragic
16.5%
Immigrants | Haiti
0.0
/100
|
#321
Tragic
16.5%
Immigrants | Barbados
0.0
/100
|
#322
Tragic
16.5%
Central American Indians
0.0
/100
|
#323
Tragic
16.5%
Immigrants | Uzbekistan
0.0
/100
|
#324
Tragic
16.5%
Nicaraguans
0.0
/100
|
#325
Tragic
16.6%
Pueblo
0.0
/100
|
#326
Tragic
16.7%
Sioux
0.0
/100
|
#327
Tragic
16.8%
Cape Verdeans
0.0
/100
|
#328
Tragic
16.8%
Immigrants | Dominica
0.0
/100
|
#329
Tragic
17.0%