Immigrants from Congo vs Immigrants from Argentina Single Female Poverty

COMPARE

Immigrants from Congo
Race
Ancestry
AfghanAfricanAlaska NativeAlaskan AthabascanAlbanianAleutAlsatianAmericanApacheArabArapahoArgentineanArmenianAssyrian/Chaldean/SyriacAustralianAustrianBahamianBangladeshiBarbadianBasqueBelgianBelizeanBermudanBhutaneseBlackfeetBolivianBrazilianBritishBritish West IndianBulgarianBurmeseCajunCambodianCanadianCape VerdeanCarpatho RusynCelticCentral AmericanCentral American IndianCherokeeCheyenneChickasawChileanChineseChippewaChoctawColombianColvilleComancheCosta RicanCreeCreekCroatianCrowCubanCypriotCzechCzechoslovakianDanishDelawareDominicanDutchDutch West IndianEastern EuropeanEcuadorianEgyptianEnglishEstonianEthiopianEuropeanFijianFilipinoFinnishFrenchFrench American IndianFrench CanadianGermanGerman RussianGhanaianGreekGuamanian/ChamorroGuatemalanGuyaneseHaitianHmongHonduranHopiHoumaHungarianIcelanderIndian (Asian)IndonesianInupiatIranianIraqiIrishIroquoisIsraeliItalianJamaicanJapaneseJordanianKenyanKiowaKoreanLaotianLatvianLebaneseLiberianLithuanianLumbeeLuxembourgerMacedonianMalaysianMalteseMarshalleseMenomineeMexicanMexican American IndianMongolianMoroccanNative HawaiianNavajoNepaleseNew ZealanderNicaraguanNigerianNorthern EuropeanNorwegianOkinawanOsageOttawaPaiutePakistaniPalestinianPanamanianParaguayanPennsylvania GermanPeruvianPimaPolishPortuguesePotawatomiPuebloPuerto RicanPuget Sound SalishRomanianRussianSalvadoranSamoanScandinavianScotch-IrishScottishSeminoleSenegaleseSerbianShoshoneSierra LeoneanSiouxSlavicSlovakSloveneSomaliSouth AfricanSouth AmericanSouth American IndianSoviet UnionSpaniardSpanishSpanish AmericanSpanish American IndianSri LankanSubsaharan AfricanSudaneseSwedishSwissSyrianTaiwaneseThaiTlingit-HaidaTohono O'OdhamTonganTrinidadian and TobagonianTsimshianTurkishU.S. Virgin IslanderUgandanUkrainianUruguayanUteVenezuelanVietnameseWelshWest IndianYakamaYaquiYugoslavianYumanYup'ikZimbabwean
Immigration
NonimmigrantsImmigrantsAfghanistanAfricaAlbaniaArmeniaAsiaAustraliaAustriaBahamasBangladeshBarbadosBelarusBelgiumBelizeBoliviaBosnia and HerzegovinaBrazilBulgariaBurma/MyanmarCabo VerdeCambodiaCameroonCanadaCaribbeanCentral AmericaChileChinaColombiaCongoCosta RicaCroatiaCubaCzechoslovakiaDenmarkDominicaDominican RepublicEastern AfricaEastern AsiaEastern EuropeEcuadorEgyptEl SalvadorEnglandEritreaEthiopiaEuropeFijiFranceGermanyGhanaGreeceGrenadaGuatemalaGuyanaHaitiHondurasHong KongHungaryIndiaIndonesiaIranIraqIrelandIsraelItalyJamaicaJapanJordanKazakhstanKenyaKoreaKuwaitLaosLatin AmericaLatviaLebanonLiberiaLithuaniaMalaysiaMexicoMicronesiaMiddle AfricaMoldovaMoroccoNepalNetherlandsNicaraguaNigeriaNorth AmericaNorth MacedoniaNorthern AfricaNorthern EuropeNorwayOceaniaPakistanPanamaPeruPhilippinesPolandPortugalRomaniaRussiaSaudi ArabiaScotlandSenegalSerbiaSierra LeoneSingaporeSomaliaSouth AfricaSouth AmericaSouth Central AsiaSouth Eastern AsiaSouthern EuropeSpainSri LankaSt. Vincent and the GrenadinesSudanSwedenSwitzerlandSyriaTaiwanThailandTrinidad and TobagoTurkeyUgandaUkraineUruguayUzbekistanVenezuelaVietnamWest IndiesWestern AfricaWestern AsiaWestern EuropeYemenZaireZimbabweAzores
Immigrants from Argentina
Race
Ancestry
AfghanAfricanAlaska NativeAlaskan AthabascanAlbanianAleutAlsatianAmericanApacheArabArapahoArgentineanArmenianAssyrian/Chaldean/SyriacAustralianAustrianBahamianBangladeshiBarbadianBasqueBelgianBelizeanBermudanBhutaneseBlackfeetBolivianBrazilianBritishBritish West IndianBulgarianBurmeseCajunCambodianCanadianCape VerdeanCarpatho RusynCelticCentral AmericanCentral American IndianCherokeeCheyenneChickasawChileanChineseChippewaChoctawColombianColvilleComancheCosta RicanCreeCreekCroatianCrowCubanCypriotCzechCzechoslovakianDanishDelawareDominicanDutchDutch West IndianEastern EuropeanEcuadorianEgyptianEnglishEstonianEthiopianEuropeanFijianFilipinoFinnishFrenchFrench American IndianFrench CanadianGermanGerman RussianGhanaianGreekGuamanian/ChamorroGuatemalanGuyaneseHaitianHmongHonduranHopiHoumaHungarianIcelanderIndian (Asian)IndonesianInupiatIranianIraqiIrishIroquoisIsraeliItalianJamaicanJapaneseJordanianKenyanKiowaKoreanLaotianLatvianLebaneseLiberianLithuanianLumbeeLuxembourgerMacedonianMalaysianMalteseMarshalleseMenomineeMexicanMexican American IndianMongolianMoroccanNative HawaiianNavajoNepaleseNew ZealanderNicaraguanNigerianNorthern EuropeanNorwegianOkinawanOsageOttawaPaiutePakistaniPalestinianPanamanianParaguayanPennsylvania GermanPeruvianPimaPolishPortuguesePotawatomiPuebloPuerto RicanPuget Sound SalishRomanianRussianSalvadoranSamoanScandinavianScotch-IrishScottishSeminoleSenegaleseSerbianShoshoneSierra LeoneanSiouxSlavicSlovakSloveneSomaliSouth AfricanSouth AmericanSouth American IndianSoviet UnionSpaniardSpanishSpanish AmericanSpanish American IndianSri LankanSubsaharan AfricanSudaneseSwedishSwissSyrianTaiwaneseThaiTlingit-HaidaTohono O'OdhamTonganTrinidadian and TobagonianTsimshianTurkishU.S. Virgin IslanderUgandanUkrainianUruguayanUteVenezuelanVietnameseWelshWest IndianYakamaYaquiYugoslavianYumanYup'ikZimbabwean
Immigration
NonimmigrantsImmigrantsAfghanistanAfricaAlbaniaArgentinaArmeniaAsiaAustraliaAustriaBahamasBangladeshBarbadosBelarusBelgiumBelizeBoliviaBosnia and HerzegovinaBrazilBulgariaBurma/MyanmarCabo VerdeCambodiaCameroonCanadaCaribbeanCentral AmericaChileChinaColombiaCosta RicaCroatiaCubaCzechoslovakiaDenmarkDominicaDominican RepublicEastern AfricaEastern AsiaEastern EuropeEcuadorEgyptEl SalvadorEnglandEritreaEthiopiaEuropeFijiFranceGermanyGhanaGreeceGrenadaGuatemalaGuyanaHaitiHondurasHong KongHungaryIndiaIndonesiaIranIraqIrelandIsraelItalyJamaicaJapanJordanKazakhstanKenyaKoreaKuwaitLaosLatin AmericaLatviaLebanonLiberiaLithuaniaMalaysiaMexicoMicronesiaMiddle AfricaMoldovaMoroccoNepalNetherlandsNicaraguaNigeriaNorth AmericaNorth MacedoniaNorthern AfricaNorthern EuropeNorwayOceaniaPakistanPanamaPeruPhilippinesPolandPortugalRomaniaRussiaSaudi ArabiaScotlandSenegalSerbiaSierra LeoneSingaporeSomaliaSouth AfricaSouth AmericaSouth Central AsiaSouth Eastern AsiaSouthern EuropeSpainSri LankaSt. Vincent and the GrenadinesSudanSwedenSwitzerlandSyriaTaiwanThailandTrinidad and TobagoTurkeyUgandaUkraineUruguayUzbekistanVenezuelaVietnamWest IndiesWestern AfricaWestern AsiaWestern EuropeYemenZaireZimbabweAzores
Single Female Poverty
Income
Poverty
Unemployment
Labor Participation
Family Structure
Vehicle Availability
Education Level
Disability

Single Female Poverty Comparison

Immigrants from Congo

Immigrants from Argentina

Tragic
Exceptional
25.3%
SINGLE FEMALE POVERTY
0.0/ 100
METRIC RATING
304th/ 347
METRIC RANK
19.0%
SINGLE FEMALE POVERTY
99.8/ 100
METRIC RATING
48th/ 347
METRIC RANK

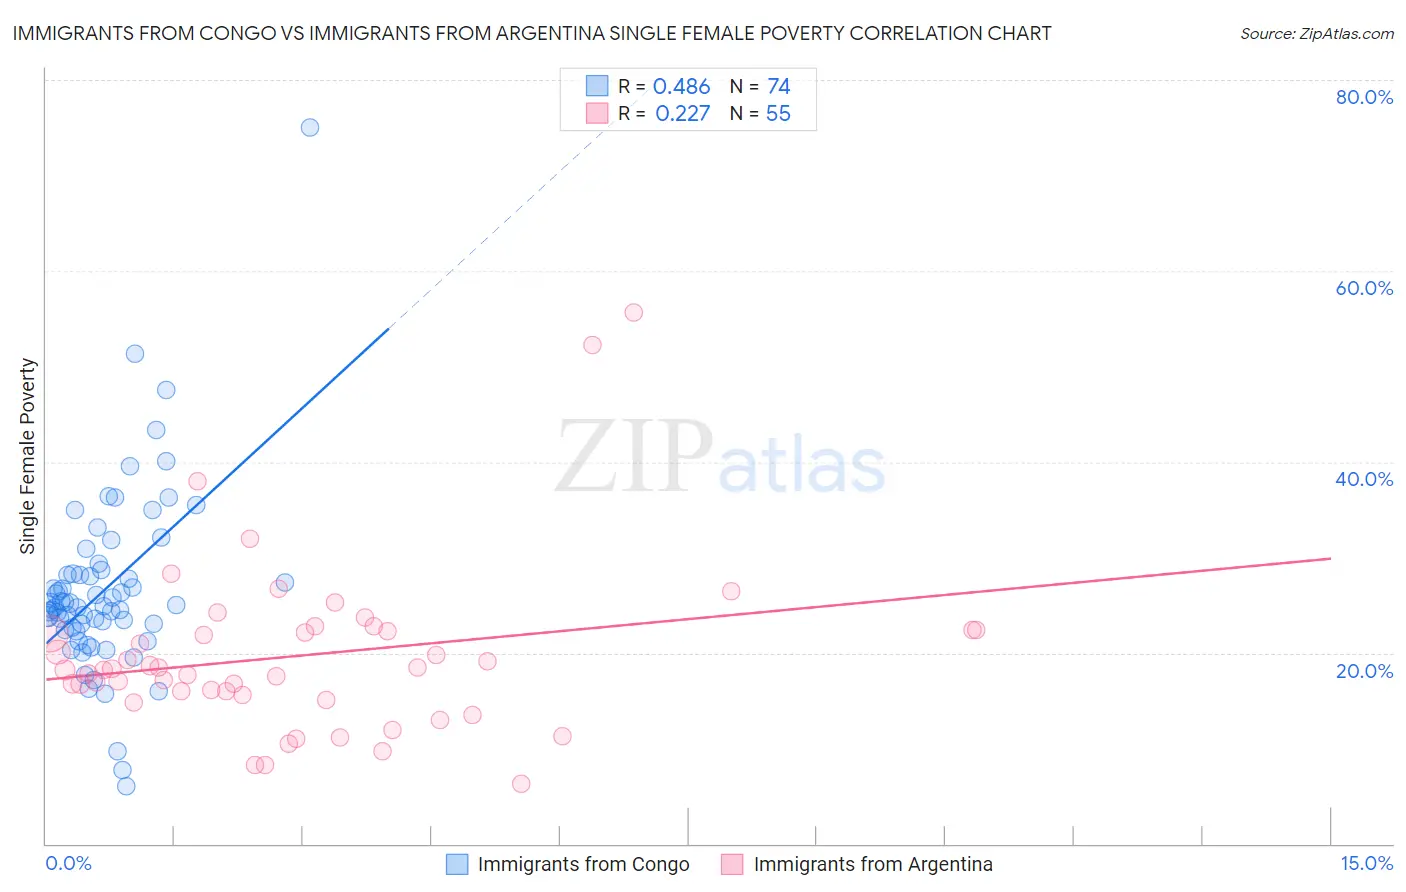
Immigrants from Congo vs Immigrants from Argentina Single Female Poverty Correlation Chart

The statistical analysis conducted on geographies consisting of 91,983,877 people shows a moderate positive correlation between the proportion of Immigrants from Congo and poverty level among single females in the United States with a correlation coefficient (R) of 0.486 and weighted average of 25.3%. Similarly, the statistical analysis conducted on geographies consisting of 261,466,881 people shows a weak positive correlation between the proportion of Immigrants from Argentina and poverty level among single females in the United States with a correlation coefficient (R) of 0.227 and weighted average of 19.0%, a difference of 32.9%.
Immigrants from Congo vs Immigrants from Argentina Single Female Poverty

Single Female Poverty Correlation Summary

MeasurementImmigrants from CongoImmigrants from Argentina
Minimum6.1%6.3%
Maximum75.0%55.7%
Range68.9%49.4%
Mean26.6%19.7%
Median24.9%18.2%
Interquartile 25% (IQ1)22.7%15.6%
Interquartile 75% (IQ3)28.3%22.4%
Interquartile Range (IQR)5.6%6.9%
Standard Deviation (Sample)9.6%8.9%
Standard Deviation (Population)9.5%8.8%

Similar Demographics by Single Female Poverty

Demographics Similar to Immigrants from Congo by Single Female Poverty

In terms of single female poverty, the demographic groups most similar to Immigrants from Congo are Immigrants from Dominican Republic (25.3%, a difference of 0.010%), Immigrants from Mexico (25.3%, a difference of 0.11%), Somali (25.2%, a difference of 0.27%), Potawatomi (25.4%, a difference of 0.34%), and Aleut (25.4%, a difference of 0.50%).
DemographicsRating | RankSingle Female Poverty
Immigrants | Central America
0.0
/100
|
#297
Tragic
24.8%
Yaqui
0.0
/100
|
#298
Tragic
24.9%
Mexicans
0.0
/100
|
#299
Tragic
25.0%
Blackfeet
0.0
/100
|
#300
Tragic
25.1%
Hondurans
0.0
/100
|
#301
Tragic
25.1%
Shoshone
0.0
/100
|
#302
Tragic
25.1%
Somalis
0.0
/100
|
#303
Tragic
25.2%
Immigrants | Congo
0.0
/100
|
#304
Tragic
25.3%
Immigrants | Dominican Republic
0.0
/100
|
#305
Tragic
25.3%
Immigrants | Mexico
0.0
/100
|
#306
Tragic
25.3%
Potawatomi
0.0
/100
|
#307
Tragic
25.4%
Aleuts
0.0
/100
|
#308
Tragic
25.4%
Dominicans
0.0
/100
|
#309
Tragic
25.4%
Central American Indians
0.0
/100
|
#310
Tragic
25.5%
Immigrants | Honduras
0.0
/100
|
#311
Tragic
25.5%

Demographics Similar to Immigrants from Argentina by Single Female Poverty

In terms of single female poverty, the demographic groups most similar to Immigrants from Argentina are Immigrants from Czechoslovakia (19.0%, a difference of 0.010%), Immigrants from Eastern Europe (19.0%, a difference of 0.050%), Immigrants from Italy (19.0%, a difference of 0.090%), Egyptian (19.1%, a difference of 0.13%), and Latvian (19.0%, a difference of 0.28%).
DemographicsRating | RankSingle Female Poverty
Immigrants | Serbia
99.9
/100
|
#41
Exceptional
18.8%
Jordanians
99.9
/100
|
#42
Exceptional
18.8%
Immigrants | Romania
99.9
/100
|
#43
Exceptional
18.8%
Immigrants | Croatia
99.9
/100
|
#44
Exceptional
18.9%
Immigrants | Indonesia
99.8
/100
|
#45
Exceptional
18.9%
Macedonians
99.8
/100
|
#46
Exceptional
18.9%
Latvians
99.8
/100
|
#47
Exceptional
19.0%
Immigrants | Argentina
99.8
/100
|
#48
Exceptional
19.0%
Immigrants | Czechoslovakia
99.8
/100
|
#49
Exceptional
19.0%
Immigrants | Eastern Europe
99.8
/100
|
#50
Exceptional
19.0%
Immigrants | Italy
99.8
/100
|
#51
Exceptional
19.0%
Egyptians
99.7
/100
|
#52
Exceptional
19.1%
Tsimshian
99.7
/100
|
#53
Exceptional
19.1%
Argentineans
99.7
/100
|
#54
Exceptional
19.1%
Immigrants | Vietnam
99.7
/100
|
#55
Exceptional
19.1%