Immigrants from China vs Lebanese Single Father Poverty
COMPARE
Immigrants from China
Lebanese
Single Father Poverty
Single Father Poverty Comparison
Immigrants from China
Lebanese
14.9%
SINGLE FATHER POVERTY
99.9/ 100
METRIC RATING
47th/ 347
METRIC RANK
17.7%
SINGLE FATHER POVERTY
0.0/ 100
METRIC RATING
277th/ 347
METRIC RANK
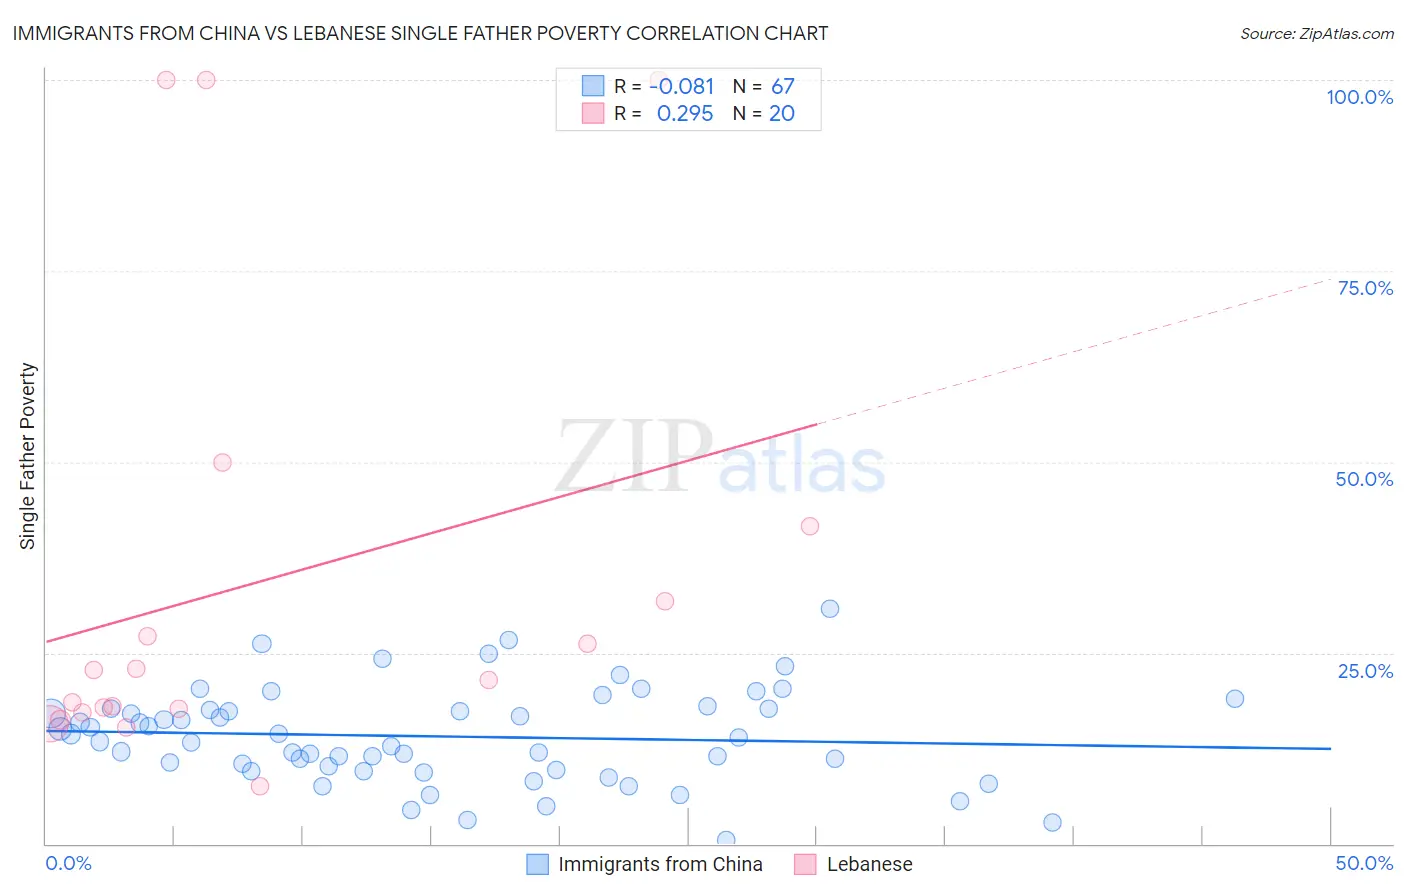
Immigrants from China vs Lebanese Single Father Poverty Correlation Chart
The statistical analysis conducted on geographies consisting of 348,182,579 people shows a slight negative correlation between the proportion of Immigrants from China and poverty level among single fathers in the United States with a correlation coefficient (R) of -0.081 and weighted average of 14.9%. Similarly, the statistical analysis conducted on geographies consisting of 311,744,378 people shows a weak positive correlation between the proportion of Lebanese and poverty level among single fathers in the United States with a correlation coefficient (R) of 0.295 and weighted average of 17.7%, a difference of 18.6%.
Single Father Poverty Correlation Summary
| Measurement | Immigrants from China | Lebanese |
| Minimum | 0.43% | 7.5% |
| Maximum | 30.8% | 100.0% |
| Range | 30.3% | 92.5% |
| Mean | 14.1% | 34.4% |
| Median | 13.9% | 22.2% |
| Interquartile 25% (IQ1) | 9.6% | 17.4% |
| Interquartile 75% (IQ3) | 17.7% | 36.6% |
| Interquartile Range (IQR) | 8.0% | 19.2% |
| Standard Deviation (Sample) | 6.2% | 29.8% |
| Standard Deviation (Population) | 6.1% | 29.1% |
Similar Demographics by Single Father Poverty
Demographics Similar to Immigrants from China by Single Father Poverty
In terms of single father poverty, the demographic groups most similar to Immigrants from China are Malaysian (14.9%, a difference of 0.010%), Immigrants from Cambodia (14.9%, a difference of 0.030%), Immigrants from Somalia (14.9%, a difference of 0.15%), Immigrants from Eastern Asia (15.0%, a difference of 0.16%), and Bhutanese (15.0%, a difference of 0.21%).
| Demographics | Rating | Rank | Single Father Poverty |
| Pima | 100.0 /100 | #40 | Exceptional 14.8% |
| Indians (Asian) | 100.0 /100 | #41 | Exceptional 14.8% |
| Immigrants | Nepal | 100.0 /100 | #42 | Exceptional 14.8% |
| Immigrants | Eritrea | 100.0 /100 | #43 | Exceptional 14.8% |
| Salvadorans | 100.0 /100 | #44 | Exceptional 14.9% |
| Immigrants | Somalia | 100.0 /100 | #45 | Exceptional 14.9% |
| Immigrants | Cambodia | 99.9 /100 | #46 | Exceptional 14.9% |
| Immigrants | China | 99.9 /100 | #47 | Exceptional 14.9% |
| Malaysians | 99.9 /100 | #48 | Exceptional 14.9% |
| Immigrants | Eastern Asia | 99.9 /100 | #49 | Exceptional 15.0% |
| Bhutanese | 99.9 /100 | #50 | Exceptional 15.0% |
| Immigrants | Pakistan | 99.9 /100 | #51 | Exceptional 15.0% |
| Immigrants | El Salvador | 99.9 /100 | #52 | Exceptional 15.0% |
| Immigrants | Kenya | 99.9 /100 | #53 | Exceptional 15.0% |
| Immigrants | Uzbekistan | 99.9 /100 | #54 | Exceptional 15.0% |
Demographics Similar to Lebanese by Single Father Poverty
In terms of single father poverty, the demographic groups most similar to Lebanese are German (17.7%, a difference of 0.010%), German Russian (17.7%, a difference of 0.15%), Iroquois (17.7%, a difference of 0.16%), Scottish (17.7%, a difference of 0.20%), and British West Indian (17.7%, a difference of 0.21%).
| Demographics | Rating | Rank | Single Father Poverty |
| Indonesians | 0.2 /100 | #270 | Tragic 17.4% |
| French American Indians | 0.2 /100 | #271 | Tragic 17.4% |
| Barbadians | 0.1 /100 | #272 | Tragic 17.5% |
| Italians | 0.1 /100 | #273 | Tragic 17.5% |
| Macedonians | 0.1 /100 | #274 | Tragic 17.7% |
| British West Indians | 0.0 /100 | #275 | Tragic 17.7% |
| German Russians | 0.0 /100 | #276 | Tragic 17.7% |
| Lebanese | 0.0 /100 | #277 | Tragic 17.7% |
| Germans | 0.0 /100 | #278 | Tragic 17.7% |
| Iroquois | 0.0 /100 | #279 | Tragic 17.7% |
| Scottish | 0.0 /100 | #280 | Tragic 17.7% |
| English | 0.0 /100 | #281 | Tragic 17.8% |
| Dutch | 0.0 /100 | #282 | Tragic 17.8% |
| Alsatians | 0.0 /100 | #283 | Tragic 17.8% |
| Welsh | 0.0 /100 | #284 | Tragic 17.8% |