Immigrants from Chile vs Immigrants from Philippines Child Poverty Among Boys Under 16
COMPARE
Immigrants from Chile
Immigrants from Philippines
Child Poverty Among Boys Under 16
Child Poverty Among Boys Under 16 Comparison
Immigrants from Chile
Immigrants from Philippines
15.9%
CHILD POVERTY AMONG BOYS UNDER 16
74.8/ 100
METRIC RATING
159th/ 347
METRIC RANK
14.3%
CHILD POVERTY AMONG BOYS UNDER 16
99.0/ 100
METRIC RATING
53rd/ 347
METRIC RANK
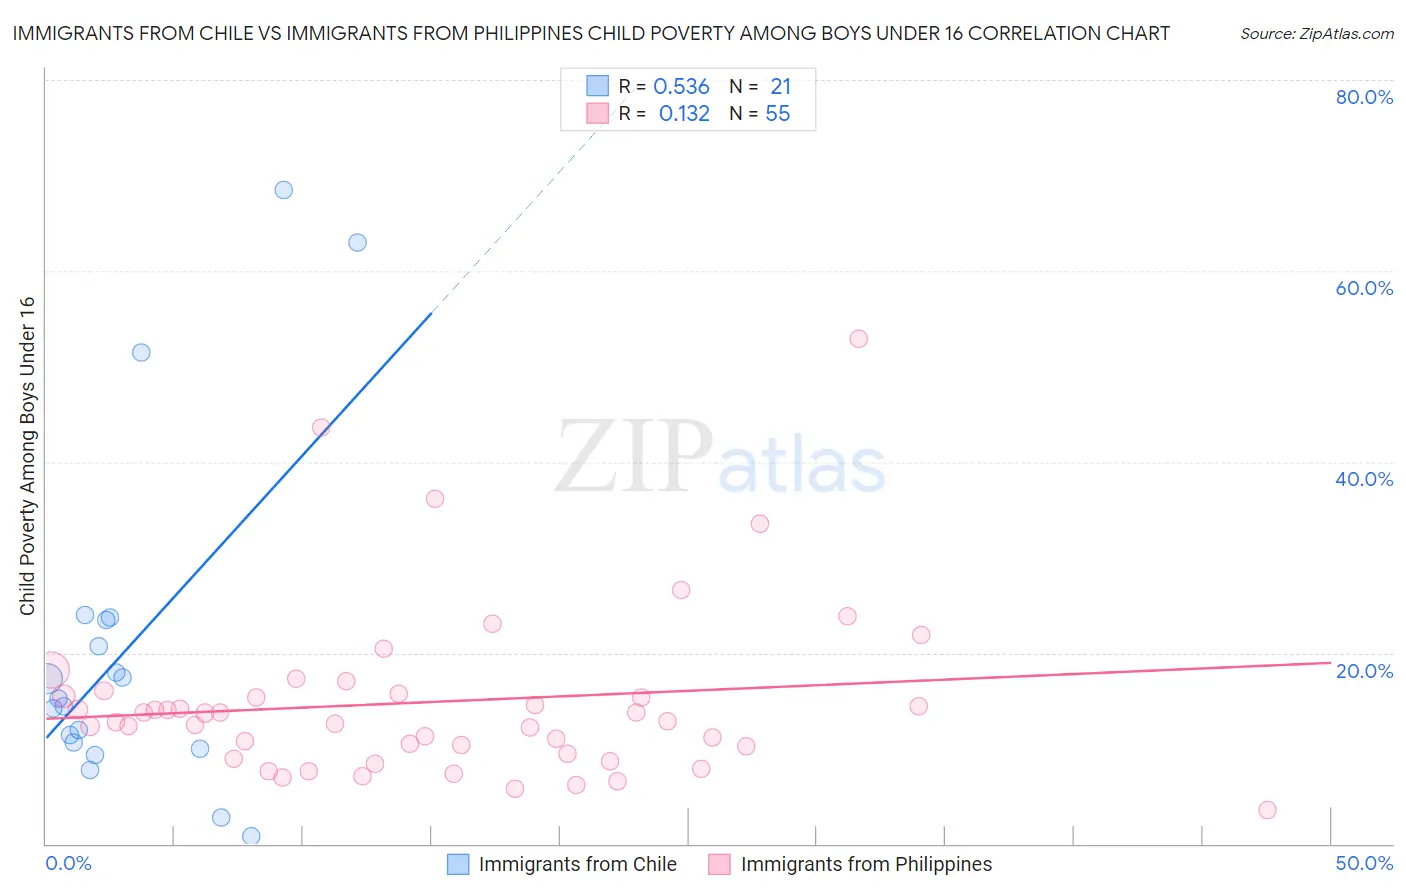
Immigrants from Chile vs Immigrants from Philippines Child Poverty Among Boys Under 16 Correlation Chart
The statistical analysis conducted on geographies consisting of 216,959,929 people shows a substantial positive correlation between the proportion of Immigrants from Chile and poverty level among boys under the age of 16 in the United States with a correlation coefficient (R) of 0.536 and weighted average of 15.9%. Similarly, the statistical analysis conducted on geographies consisting of 461,906,754 people shows a poor positive correlation between the proportion of Immigrants from Philippines and poverty level among boys under the age of 16 in the United States with a correlation coefficient (R) of 0.132 and weighted average of 14.3%, a difference of 11.2%.
Child Poverty Among Boys Under 16 Correlation Summary
| Measurement | Immigrants from Chile | Immigrants from Philippines |
| Minimum | 0.79% | 3.6% |
| Maximum | 68.4% | 52.9% |
| Range | 67.6% | 49.4% |
| Mean | 20.7% | 14.9% |
| Median | 15.2% | 12.9% |
| Interquartile 25% (IQ1) | 10.3% | 9.5% |
| Interquartile 75% (IQ3) | 23.5% | 15.7% |
| Interquartile Range (IQR) | 13.3% | 6.2% |
| Standard Deviation (Sample) | 18.1% | 9.1% |
| Standard Deviation (Population) | 17.7% | 9.0% |
Similar Demographics by Child Poverty Among Boys Under 16
Demographics Similar to Immigrants from Chile by Child Poverty Among Boys Under 16
In terms of child poverty among boys under 16, the demographic groups most similar to Immigrants from Chile are Yugoslavian (15.9%, a difference of 0.17%), Immigrants from Nepal (15.9%, a difference of 0.18%), Israeli (15.9%, a difference of 0.27%), French Canadian (15.9%, a difference of 0.28%), and Syrian (15.9%, a difference of 0.43%).
| Demographics | Rating | Rank | Child Poverty Among Boys Under 16 |
| Immigrants | Venezuela | 79.5 /100 | #152 | Good 15.8% |
| French | 78.7 /100 | #153 | Good 15.8% |
| Syrians | 77.5 /100 | #154 | Good 15.9% |
| French Canadians | 76.6 /100 | #155 | Good 15.9% |
| Israelis | 76.5 /100 | #156 | Good 15.9% |
| Immigrants | Nepal | 76.0 /100 | #157 | Good 15.9% |
| Yugoslavians | 75.9 /100 | #158 | Good 15.9% |
| Immigrants | Chile | 74.8 /100 | #159 | Good 15.9% |
| Immigrants | Northern Africa | 71.3 /100 | #160 | Good 16.0% |
| Immigrants | Oceania | 71.3 /100 | #161 | Good 16.0% |
| Guamanians/Chamorros | 69.6 /100 | #162 | Good 16.1% |
| Costa Ricans | 68.1 /100 | #163 | Good 16.1% |
| Immigrants | Albania | 67.9 /100 | #164 | Good 16.1% |
| Colombians | 65.2 /100 | #165 | Good 16.1% |
| Immigrants | Germany | 63.6 /100 | #166 | Good 16.2% |
Demographics Similar to Immigrants from Philippines by Child Poverty Among Boys Under 16
In terms of child poverty among boys under 16, the demographic groups most similar to Immigrants from Philippines are Laotian (14.3%, a difference of 0.040%), Immigrants from Serbia (14.3%, a difference of 0.080%), Immigrants from Pakistan (14.3%, a difference of 0.13%), Zimbabwean (14.3%, a difference of 0.13%), and Polish (14.4%, a difference of 0.24%).
| Demographics | Rating | Rank | Child Poverty Among Boys Under 16 |
| Greeks | 99.4 /100 | #46 | Exceptional 14.1% |
| Immigrants | Moldova | 99.4 /100 | #47 | Exceptional 14.1% |
| Immigrants | Indonesia | 99.4 /100 | #48 | Exceptional 14.1% |
| Czechs | 99.3 /100 | #49 | Exceptional 14.1% |
| Italians | 99.2 /100 | #50 | Exceptional 14.2% |
| Immigrants | Greece | 99.2 /100 | #51 | Exceptional 14.2% |
| Laotians | 99.0 /100 | #52 | Exceptional 14.3% |
| Immigrants | Philippines | 99.0 /100 | #53 | Exceptional 14.3% |
| Immigrants | Serbia | 99.0 /100 | #54 | Exceptional 14.3% |
| Immigrants | Pakistan | 99.0 /100 | #55 | Exceptional 14.3% |
| Zimbabweans | 99.0 /100 | #56 | Exceptional 14.3% |
| Poles | 98.9 /100 | #57 | Exceptional 14.4% |
| Immigrants | Sweden | 98.9 /100 | #58 | Exceptional 14.4% |
| Immigrants | Czechoslovakia | 98.9 /100 | #59 | Exceptional 14.4% |
| Immigrants | Belgium | 98.9 /100 | #60 | Exceptional 14.4% |