Immigrants from Chile vs Immigrants from Bulgaria Seniors Poverty Over the Age of 75
COMPARE
Immigrants from Chile
Immigrants from Bulgaria
Seniors Poverty Over the Age of 75
Seniors Poverty Over the Age of 75 Comparison
Immigrants from Chile
Immigrants from Bulgaria
13.3%
SENIORS POVERTY OVER THE AGE OF 75
1.3/ 100
METRIC RATING
232nd/ 347
METRIC RANK
11.5%
SENIORS POVERTY OVER THE AGE OF 75
94.7/ 100
METRIC RATING
85th/ 347
METRIC RANK
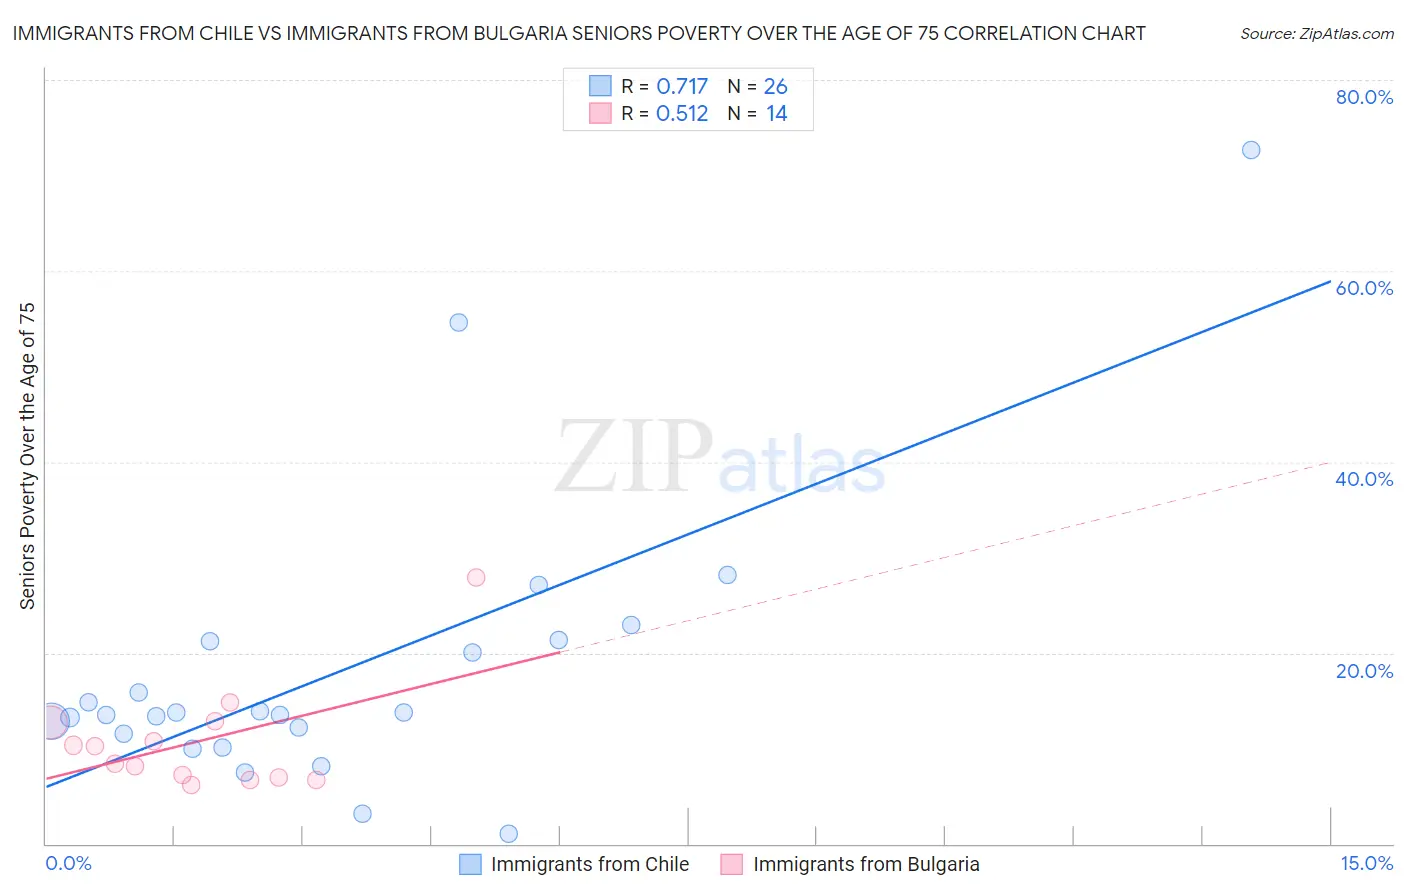
Immigrants from Chile vs Immigrants from Bulgaria Seniors Poverty Over the Age of 75 Correlation Chart
The statistical analysis conducted on geographies consisting of 217,254,783 people shows a strong positive correlation between the proportion of Immigrants from Chile and poverty level among seniors over the age of 75 in the United States with a correlation coefficient (R) of 0.717 and weighted average of 13.3%. Similarly, the statistical analysis conducted on geographies consisting of 171,858,582 people shows a substantial positive correlation between the proportion of Immigrants from Bulgaria and poverty level among seniors over the age of 75 in the United States with a correlation coefficient (R) of 0.512 and weighted average of 11.5%, a difference of 15.5%.
Seniors Poverty Over the Age of 75 Correlation Summary
| Measurement | Immigrants from Chile | Immigrants from Bulgaria |
| Minimum | 0.99% | 6.2% |
| Maximum | 72.7% | 27.9% |
| Range | 71.7% | 21.7% |
| Mean | 18.1% | 10.7% |
| Median | 13.6% | 9.3% |
| Interquartile 25% (IQ1) | 11.6% | 7.0% |
| Interquartile 75% (IQ3) | 21.3% | 12.7% |
| Interquartile Range (IQR) | 9.7% | 5.7% |
| Standard Deviation (Sample) | 15.1% | 5.6% |
| Standard Deviation (Population) | 14.8% | 5.4% |
Similar Demographics by Seniors Poverty Over the Age of 75
Demographics Similar to Immigrants from Chile by Seniors Poverty Over the Age of 75
In terms of seniors poverty over the age of 75, the demographic groups most similar to Immigrants from Chile are Immigrants from Costa Rica (13.3%, a difference of 0.030%), Subsaharan African (13.2%, a difference of 0.20%), Immigrants from China (13.2%, a difference of 0.22%), Somali (13.2%, a difference of 0.30%), and Immigrants from Israel (13.3%, a difference of 0.37%).
| Demographics | Rating | Rank | Seniors Poverty Over the Age of 75 |
| Immigrants | Morocco | 2.8 /100 | #225 | Tragic 13.1% |
| Shoshone | 2.6 /100 | #226 | Tragic 13.1% |
| Cree | 2.3 /100 | #227 | Tragic 13.1% |
| Israelis | 2.0 /100 | #228 | Tragic 13.2% |
| Somalis | 1.6 /100 | #229 | Tragic 13.2% |
| Immigrants | China | 1.5 /100 | #230 | Tragic 13.2% |
| Sub-Saharan Africans | 1.5 /100 | #231 | Tragic 13.2% |
| Immigrants | Chile | 1.3 /100 | #232 | Tragic 13.3% |
| Immigrants | Costa Rica | 1.3 /100 | #233 | Tragic 13.3% |
| Immigrants | Israel | 1.1 /100 | #234 | Tragic 13.3% |
| Japanese | 0.9 /100 | #235 | Tragic 13.3% |
| Moroccans | 0.9 /100 | #236 | Tragic 13.3% |
| Alaskan Athabascans | 0.8 /100 | #237 | Tragic 13.4% |
| Peruvians | 0.8 /100 | #238 | Tragic 13.4% |
| Panamanians | 0.8 /100 | #239 | Tragic 13.4% |
Demographics Similar to Immigrants from Bulgaria by Seniors Poverty Over the Age of 75
In terms of seniors poverty over the age of 75, the demographic groups most similar to Immigrants from Bulgaria are Australian (11.5%, a difference of 0.020%), Korean (11.5%, a difference of 0.050%), Immigrants from Croatia (11.5%, a difference of 0.070%), Immigrants from Iraq (11.5%, a difference of 0.10%), and Immigrants from Sri Lanka (11.5%, a difference of 0.10%).
| Demographics | Rating | Rank | Seniors Poverty Over the Age of 75 |
| Macedonians | 95.5 /100 | #78 | Exceptional 11.4% |
| Filipinos | 95.5 /100 | #79 | Exceptional 11.4% |
| Alaska Natives | 95.4 /100 | #80 | Exceptional 11.4% |
| Basques | 95.1 /100 | #81 | Exceptional 11.5% |
| Iranians | 95.1 /100 | #82 | Exceptional 11.5% |
| Immigrants | South Africa | 94.9 /100 | #83 | Exceptional 11.5% |
| Immigrants | Iraq | 94.9 /100 | #84 | Exceptional 11.5% |
| Immigrants | Bulgaria | 94.7 /100 | #85 | Exceptional 11.5% |
| Australians | 94.6 /100 | #86 | Exceptional 11.5% |
| Koreans | 94.5 /100 | #87 | Exceptional 11.5% |
| Immigrants | Croatia | 94.5 /100 | #88 | Exceptional 11.5% |
| Immigrants | Sri Lanka | 94.4 /100 | #89 | Exceptional 11.5% |
| Aleuts | 94.1 /100 | #90 | Exceptional 11.5% |
| Immigrants | Germany | 94.1 /100 | #91 | Exceptional 11.5% |
| Kenyans | 93.9 /100 | #92 | Exceptional 11.5% |