Immigrants from Caribbean vs Immigrants from South Africa Child Poverty Under the Age of 5
COMPARE
Immigrants from Caribbean
Immigrants from South Africa
Child Poverty Under the Age of 5
Child Poverty Under the Age of 5 Comparison
Immigrants from Caribbean
Immigrants from South Africa
21.4%
CHILD POVERTY UNDER THE AGE OF 5
0.0/ 100
METRIC RATING
290th/ 347
METRIC RANK
15.8%
CHILD POVERTY UNDER THE AGE OF 5
96.1/ 100
METRIC RATING
98th/ 347
METRIC RANK
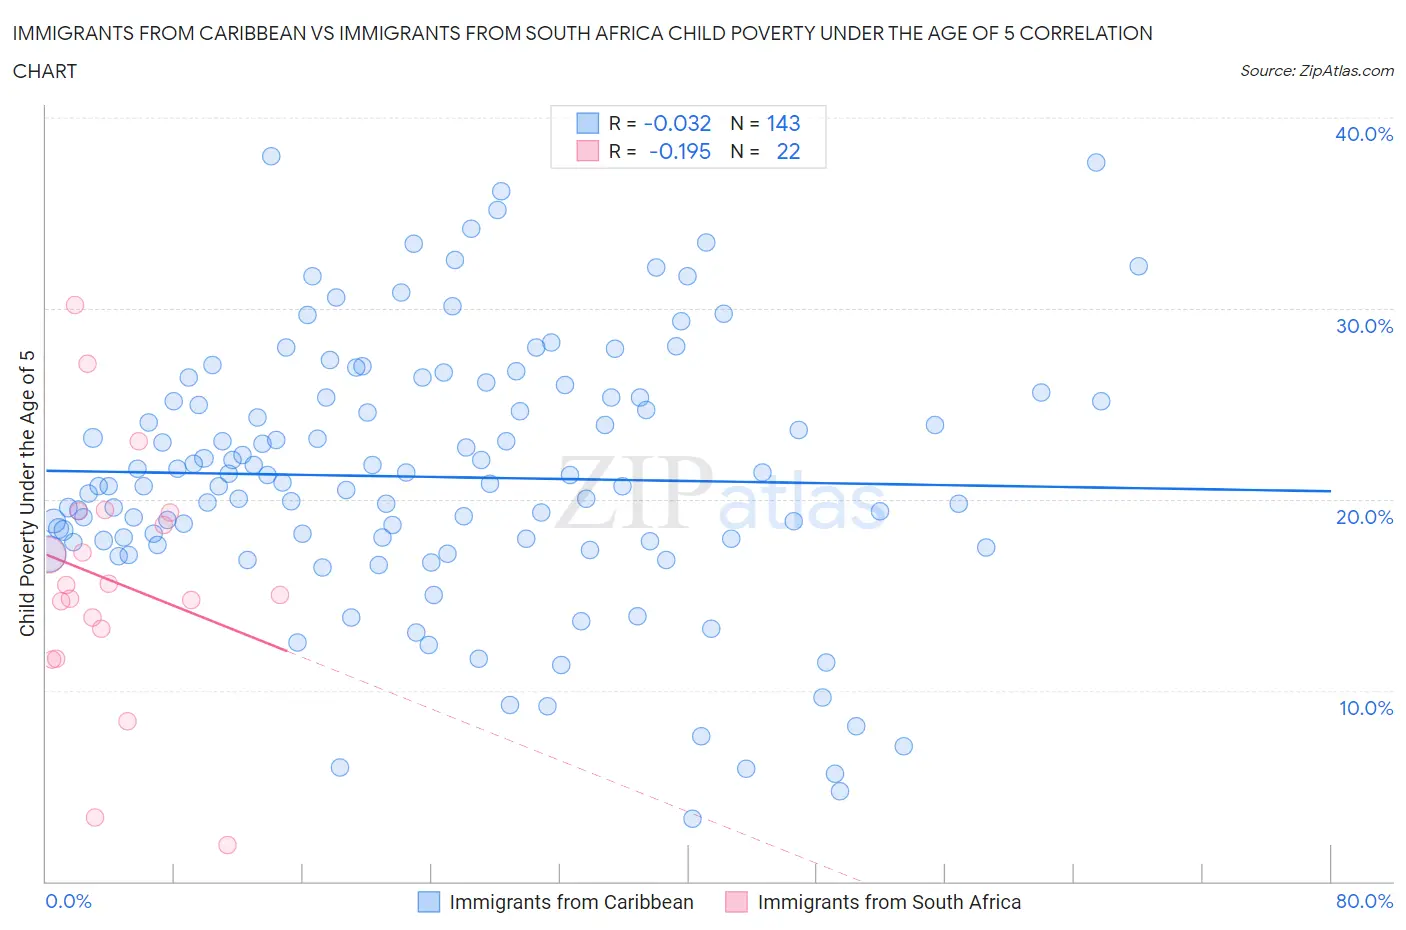
Immigrants from Caribbean vs Immigrants from South Africa Child Poverty Under the Age of 5 Correlation Chart
The statistical analysis conducted on geographies consisting of 429,670,121 people shows no correlation between the proportion of Immigrants from Caribbean and poverty level among children under the age of 5 in the United States with a correlation coefficient (R) of -0.032 and weighted average of 21.4%. Similarly, the statistical analysis conducted on geographies consisting of 224,707,543 people shows a poor negative correlation between the proportion of Immigrants from South Africa and poverty level among children under the age of 5 in the United States with a correlation coefficient (R) of -0.195 and weighted average of 15.8%, a difference of 35.3%.
Child Poverty Under the Age of 5 Correlation Summary
| Measurement | Immigrants from Caribbean | Immigrants from South Africa |
| Minimum | 3.3% | 1.9% |
| Maximum | 38.0% | 30.2% |
| Range | 34.7% | 28.3% |
| Mean | 21.2% | 15.7% |
| Median | 20.8% | 15.2% |
| Interquartile 25% (IQ1) | 17.8% | 13.2% |
| Interquartile 75% (IQ3) | 25.3% | 19.3% |
| Interquartile Range (IQR) | 7.5% | 6.1% |
| Standard Deviation (Sample) | 6.9% | 6.5% |
| Standard Deviation (Population) | 6.8% | 6.4% |
Similar Demographics by Child Poverty Under the Age of 5
Demographics Similar to Immigrants from Caribbean by Child Poverty Under the Age of 5
In terms of child poverty under the age of 5, the demographic groups most similar to Immigrants from Caribbean are British West Indian (21.4%, a difference of 0.17%), Immigrants from Haiti (21.3%, a difference of 0.41%), Immigrants from Senegal (21.3%, a difference of 0.48%), Immigrants from Zaire (21.3%, a difference of 0.65%), and Immigrants from Latin America (21.2%, a difference of 0.75%).
| Demographics | Rating | Rank | Child Poverty Under the Age of 5 |
| Comanche | 0.0 /100 | #283 | Tragic 21.0% |
| Somalis | 0.0 /100 | #284 | Tragic 21.1% |
| Haitians | 0.0 /100 | #285 | Tragic 21.2% |
| Immigrants | Latin America | 0.0 /100 | #286 | Tragic 21.2% |
| Immigrants | Zaire | 0.0 /100 | #287 | Tragic 21.3% |
| Immigrants | Senegal | 0.0 /100 | #288 | Tragic 21.3% |
| Immigrants | Haiti | 0.0 /100 | #289 | Tragic 21.3% |
| Immigrants | Caribbean | 0.0 /100 | #290 | Tragic 21.4% |
| British West Indians | 0.0 /100 | #291 | Tragic 21.4% |
| Immigrants | Somalia | 0.0 /100 | #292 | Tragic 21.6% |
| Mexicans | 0.0 /100 | #293 | Tragic 21.6% |
| Guatemalans | 0.0 /100 | #294 | Tragic 21.6% |
| Cherokee | 0.0 /100 | #295 | Tragic 21.7% |
| Yaqui | 0.0 /100 | #296 | Tragic 21.7% |
| Hispanics or Latinos | 0.0 /100 | #297 | Tragic 21.7% |
Demographics Similar to Immigrants from South Africa by Child Poverty Under the Age of 5
In terms of child poverty under the age of 5, the demographic groups most similar to Immigrants from South Africa are Macedonian (15.8%, a difference of 0.070%), Immigrants from Kazakhstan (15.8%, a difference of 0.11%), Palestinian (15.8%, a difference of 0.11%), Immigrants from Canada (15.8%, a difference of 0.13%), and Immigrants from Zimbabwe (15.8%, a difference of 0.13%).
| Demographics | Rating | Rank | Child Poverty Under the Age of 5 |
| Poles | 97.2 /100 | #91 | Exceptional 15.7% |
| Scandinavians | 97.1 /100 | #92 | Exceptional 15.7% |
| Ukrainians | 97.1 /100 | #93 | Exceptional 15.7% |
| Immigrants | South Eastern Asia | 97.1 /100 | #94 | Exceptional 15.7% |
| Immigrants | Switzerland | 96.4 /100 | #95 | Exceptional 15.8% |
| Immigrants | Kazakhstan | 96.2 /100 | #96 | Exceptional 15.8% |
| Macedonians | 96.2 /100 | #97 | Exceptional 15.8% |
| Immigrants | South Africa | 96.1 /100 | #98 | Exceptional 15.8% |
| Palestinians | 95.9 /100 | #99 | Exceptional 15.8% |
| Immigrants | Canada | 95.9 /100 | #100 | Exceptional 15.8% |
| Immigrants | Zimbabwe | 95.9 /100 | #101 | Exceptional 15.8% |
| Armenians | 95.7 /100 | #102 | Exceptional 15.8% |
| Europeans | 95.3 /100 | #103 | Exceptional 15.9% |
| Immigrants | North America | 94.9 /100 | #104 | Exceptional 15.9% |
| Immigrants | Spain | 94.8 /100 | #105 | Exceptional 15.9% |