Immigrants from Caribbean vs Immigrants from Canada Female Poverty
COMPARE
Immigrants from Caribbean
Immigrants from Canada
Female Poverty
Female Poverty Comparison
Immigrants from Caribbean
Immigrants from Canada
16.9%
FEMALE POVERTY
0.0/ 100
METRIC RATING
306th/ 347
METRIC RANK
12.3%
FEMALE POVERTY
97.5/ 100
METRIC RATING
74th/ 347
METRIC RANK
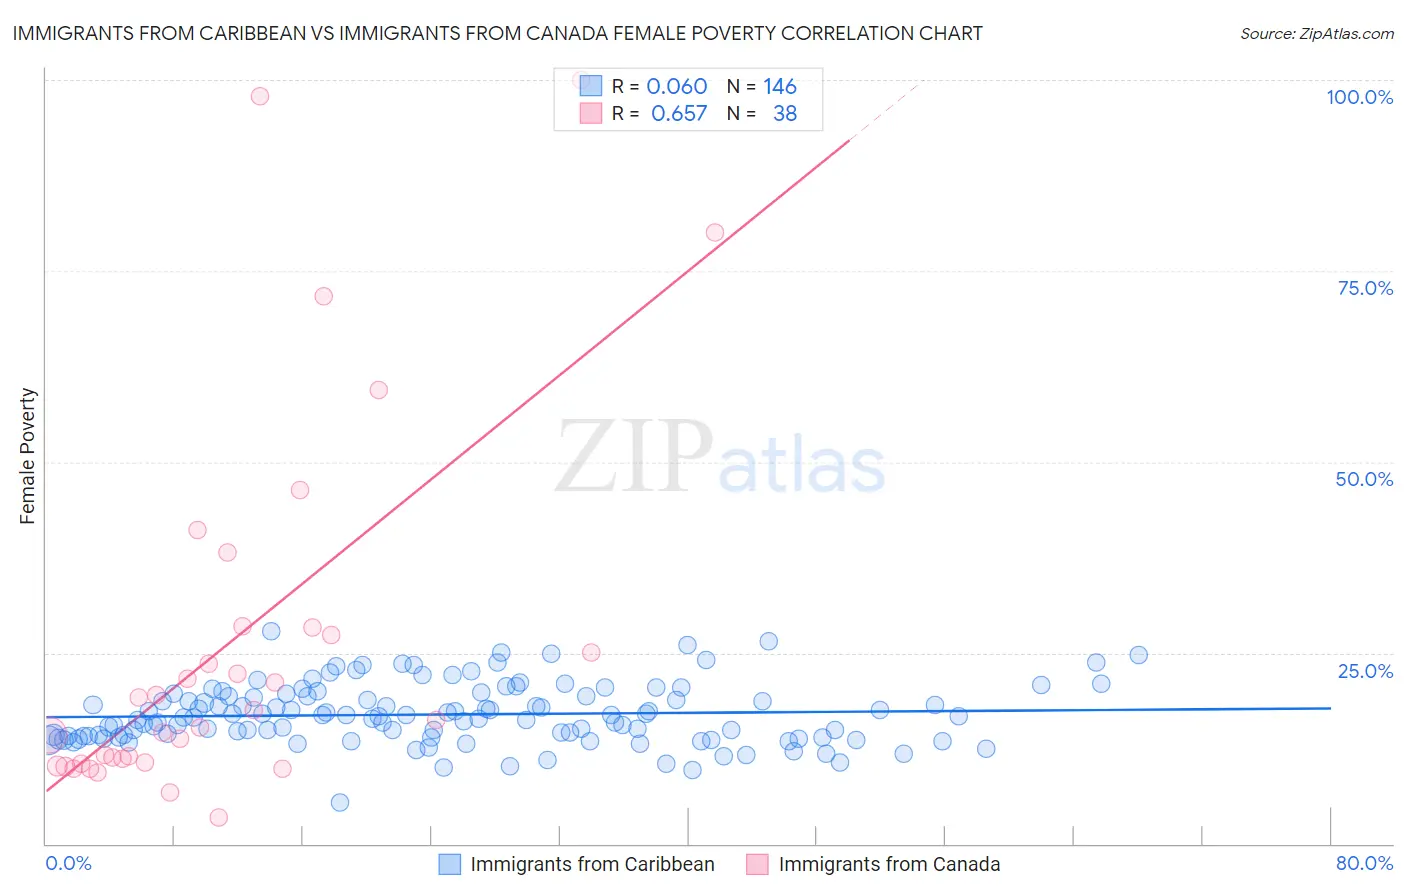
Immigrants from Caribbean vs Immigrants from Canada Female Poverty Correlation Chart
The statistical analysis conducted on geographies consisting of 449,490,616 people shows a slight positive correlation between the proportion of Immigrants from Caribbean and poverty level among females in the United States with a correlation coefficient (R) of 0.060 and weighted average of 16.9%. Similarly, the statistical analysis conducted on geographies consisting of 458,964,153 people shows a significant positive correlation between the proportion of Immigrants from Canada and poverty level among females in the United States with a correlation coefficient (R) of 0.657 and weighted average of 12.3%, a difference of 37.6%.
Female Poverty Correlation Summary
| Measurement | Immigrants from Caribbean | Immigrants from Canada |
| Minimum | 5.4% | 3.5% |
| Maximum | 27.8% | 100.0% |
| Range | 22.4% | 96.5% |
| Mean | 16.9% | 26.2% |
| Median | 16.6% | 16.9% |
| Interquartile 25% (IQ1) | 14.0% | 10.6% |
| Interquartile 75% (IQ3) | 19.4% | 28.3% |
| Interquartile Range (IQR) | 5.3% | 17.8% |
| Standard Deviation (Sample) | 3.9% | 24.5% |
| Standard Deviation (Population) | 3.9% | 24.2% |
Similar Demographics by Female Poverty
Demographics Similar to Immigrants from Caribbean by Female Poverty
In terms of female poverty, the demographic groups most similar to Immigrants from Caribbean are Seminole (16.9%, a difference of 0.12%), African (16.9%, a difference of 0.19%), Immigrants from Central America (16.8%, a difference of 0.27%), Immigrants from Grenada (16.8%, a difference of 0.27%), and Choctaw (16.8%, a difference of 0.33%).
| Demographics | Rating | Rank | Female Poverty |
| Hispanics or Latinos | 0.0 /100 | #299 | Tragic 16.6% |
| Bahamians | 0.0 /100 | #300 | Tragic 16.6% |
| Guatemalans | 0.0 /100 | #301 | Tragic 16.7% |
| Chippewa | 0.0 /100 | #302 | Tragic 16.7% |
| Choctaw | 0.0 /100 | #303 | Tragic 16.8% |
| Immigrants | Central America | 0.0 /100 | #304 | Tragic 16.8% |
| Immigrants | Grenada | 0.0 /100 | #305 | Tragic 16.8% |
| Immigrants | Caribbean | 0.0 /100 | #306 | Tragic 16.9% |
| Seminole | 0.0 /100 | #307 | Tragic 16.9% |
| Africans | 0.0 /100 | #308 | Tragic 16.9% |
| Immigrants | Mexico | 0.0 /100 | #309 | Tragic 17.0% |
| Creek | 0.0 /100 | #310 | Tragic 17.0% |
| Immigrants | Guatemala | 0.0 /100 | #311 | Tragic 17.0% |
| Immigrants | Somalia | 0.0 /100 | #312 | Tragic 17.0% |
| British West Indians | 0.0 /100 | #313 | Tragic 17.0% |
Demographics Similar to Immigrants from Canada by Female Poverty
In terms of female poverty, the demographic groups most similar to Immigrants from Canada are Zimbabwean (12.3%, a difference of 0.010%), Cambodian (12.2%, a difference of 0.030%), Carpatho Rusyn (12.2%, a difference of 0.060%), European (12.3%, a difference of 0.12%), and Immigrants from Belgium (12.2%, a difference of 0.19%).
| Demographics | Rating | Rank | Female Poverty |
| Immigrants | Eastern Asia | 97.8 /100 | #67 | Exceptional 12.2% |
| Immigrants | Netherlands | 97.8 /100 | #68 | Exceptional 12.2% |
| Swiss | 97.7 /100 | #69 | Exceptional 12.2% |
| Immigrants | Belgium | 97.7 /100 | #70 | Exceptional 12.2% |
| Carpatho Rusyns | 97.6 /100 | #71 | Exceptional 12.2% |
| Cambodians | 97.5 /100 | #72 | Exceptional 12.2% |
| Zimbabweans | 97.5 /100 | #73 | Exceptional 12.3% |
| Immigrants | Canada | 97.5 /100 | #74 | Exceptional 12.3% |
| Europeans | 97.4 /100 | #75 | Exceptional 12.3% |
| Immigrants | Eastern Europe | 97.2 /100 | #76 | Exceptional 12.3% |
| Serbians | 97.2 /100 | #77 | Exceptional 12.3% |
| Egyptians | 97.2 /100 | #78 | Exceptional 12.3% |
| Immigrants | North America | 97.1 /100 | #79 | Exceptional 12.3% |
| Slovaks | 97.1 /100 | #80 | Exceptional 12.3% |
| Immigrants | Sweden | 97.1 /100 | #81 | Exceptional 12.3% |