Immigrants from Canada vs Immigrants from Northern Africa Seniors Poverty Over the Age of 75

COMPARE

Immigrants from Canada
Race
Ancestry
AfghanAfricanAlaska NativeAlaskan AthabascanAlbanianAleutAlsatianAmericanApacheArabArapahoArgentineanArmenianAssyrian/Chaldean/SyriacAustralianAustrianBahamianBangladeshiBarbadianBasqueBelgianBelizeanBermudanBhutaneseBlackfeetBolivianBrazilianBritishBritish West IndianBulgarianBurmeseCajunCambodianCanadianCape VerdeanCarpatho RusynCelticCentral AmericanCentral American IndianCherokeeCheyenneChickasawChileanChineseChippewaChoctawColombianColvilleComancheCosta RicanCreeCreekCroatianCrowCubanCypriotCzechCzechoslovakianDanishDelawareDominicanDutchDutch West IndianEastern EuropeanEcuadorianEgyptianEnglishEstonianEthiopianEuropeanFijianFilipinoFinnishFrenchFrench American IndianFrench CanadianGermanGerman RussianGhanaianGreekGuamanian/ChamorroGuatemalanGuyaneseHaitianHmongHonduranHopiHoumaHungarianIcelanderIndian (Asian)IndonesianInupiatIranianIraqiIrishIroquoisIsraeliItalianJamaicanJapaneseJordanianKenyanKiowaKoreanLaotianLatvianLebaneseLiberianLithuanianLumbeeLuxembourgerMacedonianMalaysianMalteseMarshalleseMenomineeMexicanMexican American IndianMongolianMoroccanNative HawaiianNavajoNepaleseNew ZealanderNicaraguanNigerianNorthern EuropeanNorwegianOkinawanOsageOttawaPaiutePakistaniPalestinianPanamanianParaguayanPennsylvania GermanPeruvianPimaPolishPortuguesePotawatomiPuebloPuerto RicanPuget Sound SalishRomanianRussianSalvadoranSamoanScandinavianScotch-IrishScottishSeminoleSenegaleseSerbianShoshoneSierra LeoneanSiouxSlavicSlovakSloveneSomaliSouth AfricanSouth AmericanSouth American IndianSoviet UnionSpaniardSpanishSpanish AmericanSpanish American IndianSri LankanSubsaharan AfricanSudaneseSwedishSwissSyrianTaiwaneseThaiTlingit-HaidaTohono O'OdhamTonganTrinidadian and TobagonianTsimshianTurkishU.S. Virgin IslanderUgandanUkrainianUruguayanUteVenezuelanVietnameseWelshWest IndianYakamaYaquiYugoslavianYumanYup'ikZimbabwean
Immigration
NonimmigrantsImmigrantsAfghanistanAfricaAlbaniaArgentinaArmeniaAsiaAustraliaAustriaBahamasBangladeshBarbadosBelarusBelgiumBelizeBoliviaBosnia and HerzegovinaBrazilBulgariaBurma/MyanmarCabo VerdeCambodiaCameroonCanadaCaribbeanCentral AmericaChileChinaColombiaCongoCosta RicaCroatiaCubaCzechoslovakiaDenmarkDominicaDominican RepublicEastern AfricaEastern AsiaEastern EuropeEcuadorEgyptEl SalvadorEnglandEritreaEthiopiaEuropeFijiFranceGermanyGhanaGreeceGrenadaGuatemalaGuyanaHaitiHondurasHong KongHungaryIndiaIndonesiaIranIraqIrelandIsraelItalyJamaicaJapanJordanKazakhstanKenyaKoreaKuwaitLaosLatin AmericaLatviaLebanonLiberiaLithuaniaMalaysiaMexicoMicronesiaMiddle AfricaMoldovaMoroccoNepalNetherlandsNicaraguaNigeriaNorth AmericaNorth MacedoniaNorthern EuropeNorwayOceaniaPakistanPanamaPeruPhilippinesPolandPortugalRomaniaRussiaSaudi ArabiaScotlandSenegalSerbiaSierra LeoneSingaporeSomaliaSouth AfricaSouth AmericaSouth Central AsiaSouth Eastern AsiaSouthern EuropeSpainSri LankaSt. Vincent and the GrenadinesSudanSwedenSwitzerlandSyriaTaiwanThailandTrinidad and TobagoTurkeyUgandaUkraineUruguayUzbekistanVenezuelaVietnamWest IndiesWestern AfricaWestern AsiaWestern EuropeYemenZaireZimbabweAzores
Immigrants from Northern Africa
Race
Ancestry
AfghanAfricanAlaska NativeAlaskan AthabascanAlbanianAleutAlsatianAmericanApacheArabArapahoArgentineanArmenianAssyrian/Chaldean/SyriacAustralianAustrianBahamianBangladeshiBarbadianBasqueBelgianBelizeanBermudanBhutaneseBlackfeetBolivianBrazilianBritishBritish West IndianBulgarianBurmeseCajunCambodianCanadianCape VerdeanCarpatho RusynCelticCentral AmericanCentral American IndianCherokeeCheyenneChickasawChileanChineseChippewaChoctawColombianColvilleComancheCosta RicanCreeCreekCroatianCrowCubanCypriotCzechCzechoslovakianDanishDelawareDominicanDutchDutch West IndianEastern EuropeanEcuadorianEgyptianEnglishEstonianEthiopianEuropeanFijianFilipinoFinnishFrenchFrench American IndianFrench CanadianGermanGerman RussianGhanaianGreekGuamanian/ChamorroGuatemalanGuyaneseHaitianHmongHonduranHopiHoumaHungarianIcelanderIndian (Asian)IndonesianInupiatIranianIraqiIrishIroquoisIsraeliItalianJamaicanJapaneseJordanianKenyanKiowaKoreanLaotianLatvianLebaneseLiberianLithuanianLumbeeLuxembourgerMacedonianMalaysianMalteseMarshalleseMenomineeMexicanMexican American IndianMongolianMoroccanNative HawaiianNavajoNepaleseNew ZealanderNicaraguanNigerianNorthern EuropeanNorwegianOkinawanOsageOttawaPaiutePakistaniPalestinianPanamanianParaguayanPennsylvania GermanPeruvianPimaPolishPortuguesePotawatomiPuebloPuerto RicanPuget Sound SalishRomanianRussianSalvadoranSamoanScandinavianScotch-IrishScottishSeminoleSenegaleseSerbianShoshoneSierra LeoneanSiouxSlavicSlovakSloveneSomaliSouth AfricanSouth AmericanSouth American IndianSoviet UnionSpaniardSpanishSpanish AmericanSpanish American IndianSri LankanSubsaharan AfricanSudaneseSwedishSwissSyrianTaiwaneseThaiTlingit-HaidaTohono O'OdhamTonganTrinidadian and TobagonianTsimshianTurkishU.S. Virgin IslanderUgandanUkrainianUruguayanUteVenezuelanVietnameseWelshWest IndianYakamaYaquiYugoslavianYumanYup'ikZimbabwean
Immigration
NonimmigrantsImmigrantsAfghanistanAfricaAlbaniaArgentinaArmeniaAsiaAustraliaAustriaBahamasBangladeshBarbadosBelarusBelgiumBelizeBoliviaBosnia and HerzegovinaBrazilBulgariaBurma/MyanmarCabo VerdeCambodiaCameroonCaribbeanCentral AmericaChileChinaColombiaCongoCosta RicaCroatiaCubaCzechoslovakiaDenmarkDominicaDominican RepublicEastern AfricaEastern AsiaEastern EuropeEcuadorEgyptEl SalvadorEnglandEritreaEthiopiaEuropeFijiFranceGermanyGhanaGreeceGrenadaGuatemalaGuyanaHaitiHondurasHong KongHungaryIndiaIndonesiaIranIraqIrelandIsraelItalyJamaicaJapanJordanKazakhstanKenyaKoreaKuwaitLaosLatin AmericaLatviaLebanonLiberiaLithuaniaMalaysiaMexicoMicronesiaMiddle AfricaMoldovaMoroccoNepalNetherlandsNicaraguaNigeriaNorth AmericaNorth MacedoniaNorthern AfricaNorthern EuropeNorwayOceaniaPakistanPanamaPeruPhilippinesPolandPortugalRomaniaRussiaSaudi ArabiaScotlandSenegalSerbiaSierra LeoneSingaporeSomaliaSouth AfricaSouth AmericaSouth Central AsiaSouth Eastern AsiaSouthern EuropeSpainSri LankaSt. Vincent and the GrenadinesSudanSwedenSwitzerlandSyriaTaiwanThailandTrinidad and TobagoTurkeyUgandaUkraineUruguayUzbekistanVenezuelaVietnamWest IndiesWestern AfricaWestern AsiaWestern EuropeYemenZaireZimbabweAzores
Seniors Poverty Over the Age of 75
Income
Poverty
Unemployment
Labor Participation
Family Structure
Vehicle Availability
Education Level
Disability

Seniors Poverty Over the Age of 75 Comparison

Immigrants from Canada

Immigrants from Northern Africa

Exceptional
Fair
11.2%
SENIORS POVERTY OVER THE AGE OF 75
97.9/ 100
METRIC RATING
57th/ 347
METRIC RANK
12.5%
SENIORS POVERTY OVER THE AGE OF 75
25.2/ 100
METRIC RATING
188th/ 347
METRIC RANK

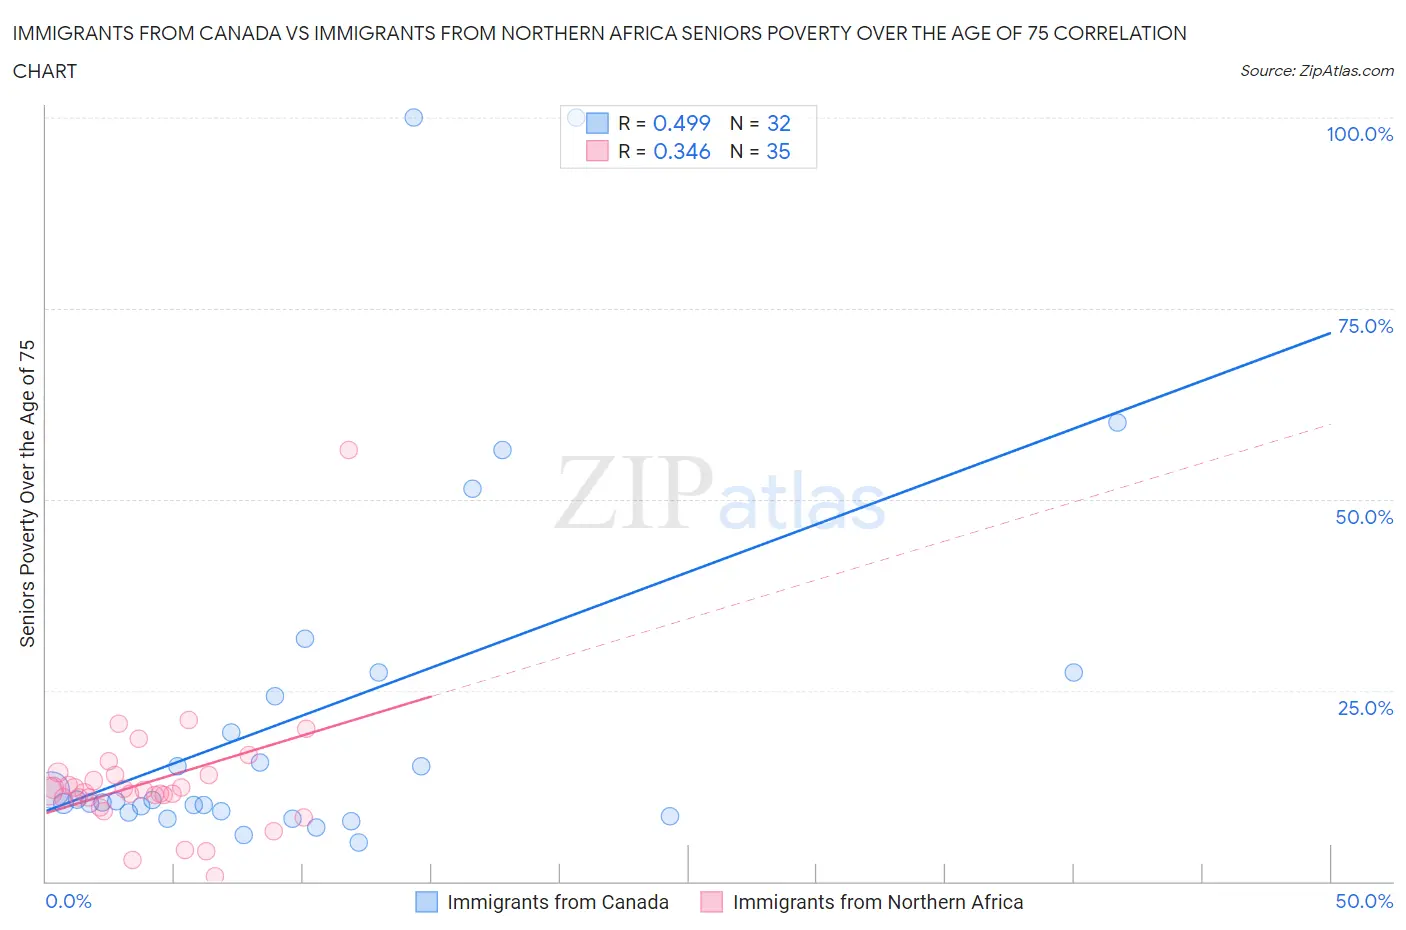
Immigrants from Canada vs Immigrants from Northern Africa Seniors Poverty Over the Age of 75 Correlation Chart

The statistical analysis conducted on geographies consisting of 452,026,685 people shows a moderate positive correlation between the proportion of Immigrants from Canada and poverty level among seniors over the age of 75 in the United States with a correlation coefficient (R) of 0.499 and weighted average of 11.2%. Similarly, the statistical analysis conducted on geographies consisting of 318,437,817 people shows a mild positive correlation between the proportion of Immigrants from Northern Africa and poverty level among seniors over the age of 75 in the United States with a correlation coefficient (R) of 0.346 and weighted average of 12.5%, a difference of 10.9%.
Immigrants from Canada vs Immigrants from Northern Africa Seniors Poverty Over the Age of 75

Seniors Poverty Over the Age of 75 Correlation Summary

MeasurementImmigrants from CanadaImmigrants from Northern Africa
Minimum5.0%0.66%
Maximum100.0%56.4%
Range95.0%55.7%
Mean22.4%13.0%
Median10.5%11.8%
Interquartile 25% (IQ1)9.1%10.9%
Interquartile 75% (IQ3)25.8%14.0%
Interquartile Range (IQR)16.7%3.1%
Standard Deviation (Sample)24.9%8.8%
Standard Deviation (Population)24.5%8.7%

Similar Demographics by Seniors Poverty Over the Age of 75

Demographics Similar to Immigrants from Canada by Seniors Poverty Over the Age of 75

In terms of seniors poverty over the age of 75, the demographic groups most similar to Immigrants from Canada are Yugoslavian (11.2%, a difference of 0.040%), Immigrants from Netherlands (11.2%, a difference of 0.12%), Slavic (11.2%, a difference of 0.23%), Eastern European (11.3%, a difference of 0.23%), and Hungarian (11.2%, a difference of 0.24%).
DemographicsRating | RankSeniors Poverty Over the Age of 75
Serbians
98.6
/100
|
#50
Exceptional
11.1%
Immigrants | North Macedonia
98.6
/100
|
#51
Exceptional
11.1%
Zimbabweans
98.5
/100
|
#52
Exceptional
11.2%
Immigrants | England
98.4
/100
|
#53
Exceptional
11.2%
Afghans
98.2
/100
|
#54
Exceptional
11.2%
Hungarians
98.1
/100
|
#55
Exceptional
11.2%
Slavs
98.1
/100
|
#56
Exceptional
11.2%
Immigrants | Canada
97.9
/100
|
#57
Exceptional
11.2%
Yugoslavians
97.9
/100
|
#58
Exceptional
11.2%
Immigrants | Netherlands
97.8
/100
|
#59
Exceptional
11.2%
Eastern Europeans
97.7
/100
|
#60
Exceptional
11.3%
Canadians
97.7
/100
|
#61
Exceptional
11.3%
Immigrants | North America
97.6
/100
|
#62
Exceptional
11.3%
Immigrants | Afghanistan
97.5
/100
|
#63
Exceptional
11.3%
Immigrants | Northern Europe
97.4
/100
|
#64
Exceptional
11.3%

Demographics Similar to Immigrants from Northern Africa by Seniors Poverty Over the Age of 75

In terms of seniors poverty over the age of 75, the demographic groups most similar to Immigrants from Northern Africa are Yaqui (12.5%, a difference of 0.070%), Immigrants from Indonesia (12.5%, a difference of 0.090%), Immigrants from Congo (12.5%, a difference of 0.15%), Liberian (12.5%, a difference of 0.22%), and Choctaw (12.5%, a difference of 0.57%).
DemographicsRating | RankSeniors Poverty Over the Age of 75
Immigrants | Australia
44.2
/100
|
#181
Average
12.2%
German Russians
41.4
/100
|
#182
Average
12.3%
Laotians
38.2
/100
|
#183
Fair
12.3%
Kiowa
36.0
/100
|
#184
Fair
12.3%
Immigrants | Malaysia
35.8
/100
|
#185
Fair
12.3%
Sri Lankans
32.3
/100
|
#186
Fair
12.4%
Yaqui
25.9
/100
|
#187
Fair
12.5%
Immigrants | Northern Africa
25.2
/100
|
#188
Fair
12.5%
Immigrants | Indonesia
24.4
/100
|
#189
Fair
12.5%
Immigrants | Congo
23.9
/100
|
#190
Fair
12.5%
Liberians
23.2
/100
|
#191
Fair
12.5%
Choctaw
20.2
/100
|
#192
Fair
12.5%
Taiwanese
17.8
/100
|
#193
Poor
12.6%
Alsatians
17.7
/100
|
#194
Poor
12.6%
Immigrants | France
17.4
/100
|
#195
Poor
12.6%