Immigrants from Cameroon vs U.S. Virgin Islander Poverty

COMPARE

Immigrants from Cameroon
Race
Ancestry
AfghanAfricanAlaska NativeAlaskan AthabascanAlbanianAleutAlsatianAmericanApacheArabArapahoArgentineanArmenianAssyrian/Chaldean/SyriacAustralianAustrianBahamianBangladeshiBarbadianBasqueBelgianBelizeanBermudanBhutaneseBlackfeetBolivianBrazilianBritishBritish West IndianBulgarianBurmeseCajunCambodianCanadianCape VerdeanCarpatho RusynCelticCentral AmericanCentral American IndianCherokeeCheyenneChickasawChileanChineseChippewaChoctawColombianColvilleComancheCosta RicanCreeCreekCroatianCrowCubanCypriotCzechCzechoslovakianDanishDelawareDominicanDutchDutch West IndianEastern EuropeanEcuadorianEgyptianEnglishEstonianEthiopianEuropeanFijianFilipinoFinnishFrenchFrench American IndianFrench CanadianGermanGerman RussianGhanaianGreekGuamanian/ChamorroGuatemalanGuyaneseHaitianHmongHonduranHopiHoumaHungarianIcelanderIndian (Asian)IndonesianInupiatIranianIraqiIrishIroquoisIsraeliItalianJamaicanJapaneseJordanianKenyanKiowaKoreanLaotianLatvianLebaneseLiberianLithuanianLumbeeLuxembourgerMacedonianMalaysianMalteseMarshalleseMenomineeMexicanMexican American IndianMongolianMoroccanNative HawaiianNavajoNepaleseNew ZealanderNicaraguanNigerianNorthern EuropeanNorwegianOkinawanOsageOttawaPaiutePakistaniPalestinianPanamanianParaguayanPennsylvania GermanPeruvianPimaPolishPortuguesePotawatomiPuebloPuerto RicanPuget Sound SalishRomanianRussianSalvadoranSamoanScandinavianScotch-IrishScottishSeminoleSenegaleseSerbianShoshoneSierra LeoneanSiouxSlavicSlovakSloveneSomaliSouth AfricanSouth AmericanSouth American IndianSoviet UnionSpaniardSpanishSpanish AmericanSpanish American IndianSri LankanSubsaharan AfricanSudaneseSwedishSwissSyrianTaiwaneseThaiTlingit-HaidaTohono O'OdhamTonganTrinidadian and TobagonianTsimshianTurkishUgandanUkrainianUruguayanUteVenezuelanVietnameseWelshWest IndianYakamaYaquiYugoslavianYumanYup'ikZimbabwean
Immigration
NonimmigrantsImmigrantsAfghanistanAfricaAlbaniaArgentinaArmeniaAsiaAustraliaAustriaBahamasBangladeshBarbadosBelarusBelgiumBelizeBoliviaBosnia and HerzegovinaBrazilBulgariaBurma/MyanmarCabo VerdeCambodiaCameroonCanadaCaribbeanCentral AmericaChileChinaColombiaCongoCosta RicaCroatiaCubaCzechoslovakiaDenmarkDominicaDominican RepublicEastern AfricaEastern AsiaEastern EuropeEcuadorEgyptEl SalvadorEnglandEritreaEthiopiaEuropeFijiFranceGermanyGhanaGreeceGrenadaGuatemalaGuyanaHaitiHondurasHong KongHungaryIndiaIndonesiaIranIraqIrelandIsraelItalyJamaicaJapanJordanKazakhstanKenyaKoreaKuwaitLaosLatin AmericaLatviaLebanonLiberiaLithuaniaMalaysiaMexicoMicronesiaMiddle AfricaMoldovaMoroccoNepalNetherlandsNicaraguaNigeriaNorth AmericaNorth MacedoniaNorthern AfricaNorthern EuropeNorwayOceaniaPakistanPanamaPeruPhilippinesPolandPortugalRomaniaRussiaSaudi ArabiaScotlandSenegalSerbiaSierra LeoneSingaporeSomaliaSouth AfricaSouth AmericaSouth Central AsiaSouth Eastern AsiaSouthern EuropeSpainSri LankaSt. Vincent and the GrenadinesSudanSwedenSwitzerlandSyriaTaiwanThailandTrinidad and TobagoTurkeyUgandaUkraineUruguayUzbekistanVenezuelaVietnamWest IndiesWestern AfricaWestern AsiaWestern EuropeYemenZaireZimbabweAzores
U.S. Virgin Islander
Race
Ancestry
AfghanAfricanAlaska NativeAlaskan AthabascanAlbanianAleutAlsatianAmericanApacheArabArapahoArgentineanArmenianAssyrian/Chaldean/SyriacAustralianAustrianBahamianBangladeshiBarbadianBasqueBelgianBelizeanBermudanBhutaneseBlackfeetBolivianBrazilianBritishBritish West IndianBulgarianBurmeseCajunCambodianCanadianCape VerdeanCarpatho RusynCelticCentral AmericanCentral American IndianCherokeeCheyenneChickasawChileanChineseChippewaChoctawColombianColvilleComancheCosta RicanCreeCreekCroatianCrowCubanCypriotCzechCzechoslovakianDanishDelawareDominicanDutchDutch West IndianEastern EuropeanEcuadorianEgyptianEnglishEstonianEthiopianEuropeanFijianFilipinoFinnishFrenchFrench American IndianFrench CanadianGermanGerman RussianGhanaianGreekGuamanian/ChamorroGuatemalanGuyaneseHaitianHmongHonduranHopiHoumaHungarianIcelanderIndian (Asian)IndonesianInupiatIranianIraqiIrishIroquoisIsraeliItalianJamaicanJapaneseJordanianKenyanKiowaKoreanLaotianLatvianLebaneseLiberianLithuanianLumbeeLuxembourgerMacedonianMalaysianMalteseMarshalleseMenomineeMexicanMexican American IndianMongolianMoroccanNative HawaiianNavajoNepaleseNew ZealanderNicaraguanNigerianNorthern EuropeanNorwegianOkinawanOsageOttawaPaiutePakistaniPalestinianPanamanianParaguayanPennsylvania GermanPeruvianPimaPolishPortuguesePotawatomiPuebloPuerto RicanPuget Sound SalishRomanianRussianSalvadoranSamoanScandinavianScotch-IrishScottishSeminoleSenegaleseSerbianShoshoneSierra LeoneanSiouxSlavicSlovakSloveneSomaliSouth AfricanSouth AmericanSouth American IndianSoviet UnionSpaniardSpanishSpanish AmericanSpanish American IndianSri LankanSubsaharan AfricanSudaneseSwedishSwissSyrianTaiwaneseThaiTlingit-HaidaTohono O'OdhamTonganTrinidadian and TobagonianTsimshianTurkishU.S. Virgin IslanderUgandanUkrainianUruguayanUteVenezuelanVietnameseWelshWest IndianYakamaYaquiYugoslavianYumanYup'ikZimbabwean
Immigration
NonimmigrantsImmigrantsAfghanistanAfricaAlbaniaArgentinaArmeniaAsiaAustraliaAustriaBahamasBangladeshBarbadosBelarusBelgiumBelizeBoliviaBosnia and HerzegovinaBrazilBulgariaBurma/MyanmarCabo VerdeCambodiaCanadaCaribbeanCentral AmericaChileChinaColombiaCongoCosta RicaCroatiaCubaCzechoslovakiaDenmarkDominicaDominican RepublicEastern AfricaEastern AsiaEastern EuropeEcuadorEgyptEl SalvadorEnglandEritreaEthiopiaEuropeFijiFranceGermanyGhanaGreeceGrenadaGuatemalaGuyanaHaitiHondurasHong KongHungaryIndiaIndonesiaIranIraqIrelandIsraelItalyJamaicaJapanJordanKazakhstanKenyaKoreaKuwaitLaosLatin AmericaLatviaLebanonLiberiaLithuaniaMalaysiaMexicoMicronesiaMiddle AfricaMoldovaMoroccoNepalNetherlandsNicaraguaNigeriaNorth AmericaNorth MacedoniaNorthern AfricaNorthern EuropeNorwayOceaniaPakistanPanamaPeruPhilippinesPolandPortugalRomaniaRussiaSaudi ArabiaScotlandSenegalSerbiaSierra LeoneSingaporeSomaliaSouth AfricaSouth AmericaSouth Central AsiaSouth Eastern AsiaSouthern EuropeSpainSri LankaSt. Vincent and the GrenadinesSudanSwedenSwitzerlandSyriaTaiwanThailandTrinidad and TobagoTurkeyUgandaUkraineUruguayUzbekistanVenezuelaVietnamWest IndiesWestern AfricaWestern AsiaWestern EuropeYemenZaireZimbabweAzores
Poverty
Income
Poverty
Unemployment
Labor Participation
Family Structure
Vehicle Availability
Education Level
Disability

Poverty Comparison

Immigrants from Cameroon

U.S. Virgin Islanders

Average
Tragic
12.4%
POVERTY
41.7/ 100
METRIC RATING
182nd/ 347
METRIC RANK
16.1%
POVERTY
0.0/ 100
METRIC RATING
317th/ 347
METRIC RANK

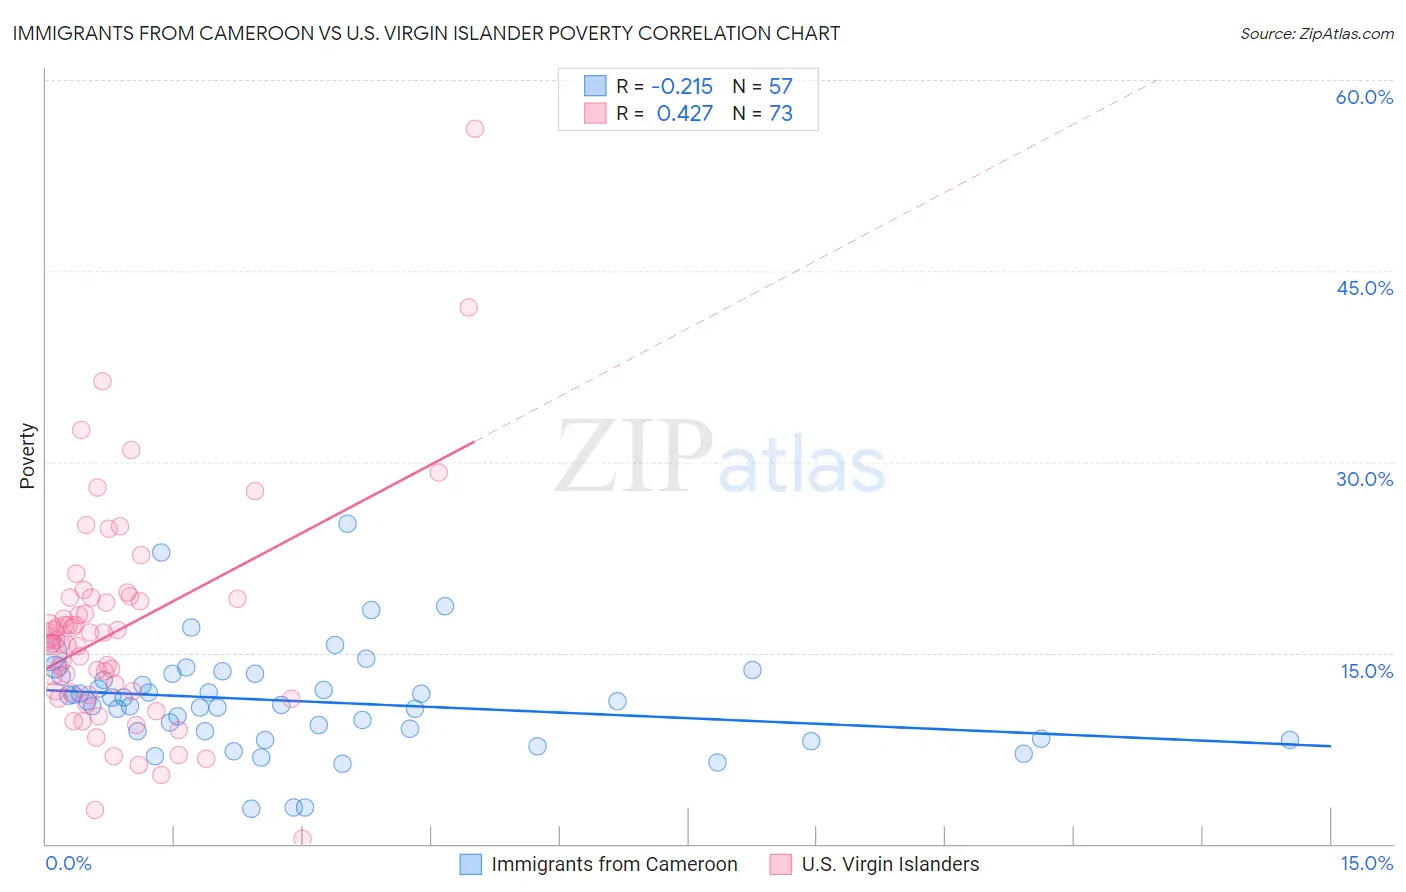
Immigrants from Cameroon vs U.S. Virgin Islander Poverty Correlation Chart

The statistical analysis conducted on geographies consisting of 130,723,030 people shows a weak negative correlation between the proportion of Immigrants from Cameroon and poverty level in the United States with a correlation coefficient (R) of -0.215 and weighted average of 12.4%. Similarly, the statistical analysis conducted on geographies consisting of 87,513,467 people shows a moderate positive correlation between the proportion of U.S. Virgin Islanders and poverty level in the United States with a correlation coefficient (R) of 0.427 and weighted average of 16.1%, a difference of 29.3%.
Immigrants from Cameroon vs U.S. Virgin Islander Poverty

Poverty Correlation Summary

MeasurementImmigrants from CameroonU.S. Virgin Islander
Minimum2.7%0.43%
Maximum25.1%56.2%
Range22.4%55.8%
Mean11.2%16.8%
Median11.2%16.0%
Interquartile 25% (IQ1)8.5%11.8%
Interquartile 75% (IQ3)13.2%19.3%
Interquartile Range (IQR)4.7%7.5%
Standard Deviation (Sample)4.2%8.7%
Standard Deviation (Population)4.1%8.6%

Similar Demographics by Poverty

Demographics Similar to Immigrants from Cameroon by Poverty

In terms of poverty, the demographic groups most similar to Immigrants from Cameroon are Immigrants from Afghanistan (12.4%, a difference of 0.040%), Immigrants from Iraq (12.4%, a difference of 0.15%), Mongolian (12.4%, a difference of 0.19%), Immigrants from Morocco (12.4%, a difference of 0.23%), and Uruguayan (12.4%, a difference of 0.29%).
DemographicsRating | RankPoverty
South Americans
48.7
/100
|
#175
Average
12.3%
Immigrants | Colombia
47.7
/100
|
#176
Average
12.3%
Immigrants | Syria
47.5
/100
|
#177
Average
12.3%
Uruguayans
44.7
/100
|
#178
Average
12.4%
Immigrants | Morocco
44.0
/100
|
#179
Average
12.4%
Mongolians
43.6
/100
|
#180
Average
12.4%
Immigrants | Afghanistan
42.1
/100
|
#181
Average
12.4%
Immigrants | Cameroon
41.7
/100
|
#182
Average
12.4%
Immigrants | Iraq
40.2
/100
|
#183
Average
12.4%
Kenyans
38.8
/100
|
#184
Fair
12.5%
Israelis
36.4
/100
|
#185
Fair
12.5%
Immigrants | Sierra Leone
36.3
/100
|
#186
Fair
12.5%
Hawaiians
34.1
/100
|
#187
Fair
12.5%
Immigrants | Costa Rica
33.3
/100
|
#188
Fair
12.5%
Aleuts
33.2
/100
|
#189
Fair
12.5%

Demographics Similar to U.S. Virgin Islanders by Poverty

In terms of poverty, the demographic groups most similar to U.S. Virgin Islanders are Immigrants from Dominica (16.1%, a difference of 0.29%), Immigrants from Congo (16.1%, a difference of 0.49%), Immigrants from Honduras (16.2%, a difference of 0.72%), British West Indian (15.9%, a difference of 1.3%), and Honduran (15.9%, a difference of 1.3%).
DemographicsRating | RankPoverty
Dutch West Indians
0.0
/100
|
#310
Tragic
15.6%
Chippewa
0.0
/100
|
#311
Tragic
15.7%
Cajuns
0.0
/100
|
#312
Tragic
15.7%
Immigrants | Grenada
0.0
/100
|
#313
Tragic
15.8%
Immigrants | Somalia
0.0
/100
|
#314
Tragic
15.8%
British West Indians
0.0
/100
|
#315
Tragic
15.9%
Hondurans
0.0
/100
|
#316
Tragic
15.9%
U.S. Virgin Islanders
0.0
/100
|
#317
Tragic
16.1%
Immigrants | Dominica
0.0
/100
|
#318
Tragic
16.1%
Immigrants | Congo
0.0
/100
|
#319
Tragic
16.1%
Immigrants | Honduras
0.0
/100
|
#320
Tragic
16.2%
Arapaho
0.0
/100
|
#321
Tragic
16.3%
Menominee
0.0
/100
|
#322
Tragic
16.4%
Colville
0.0
/100
|
#323
Tragic
16.6%
Yakama
0.0
/100
|
#324
Tragic
16.7%