Immigrants from Burma/Myanmar vs Vietnamese Child Poverty Among Girls Under 16
COMPARE
Immigrants from Burma/Myanmar
Vietnamese
Child Poverty Among Girls Under 16
Child Poverty Among Girls Under 16 Comparison
Immigrants from Burma/Myanmar
Vietnamese
19.7%
CHILD POVERTY AMONG GIRLS UNDER 16
0.1/ 100
METRIC RATING
263rd/ 347
METRIC RANK
19.5%
CHILD POVERTY AMONG GIRLS UNDER 16
0.2/ 100
METRIC RATING
261st/ 347
METRIC RANK
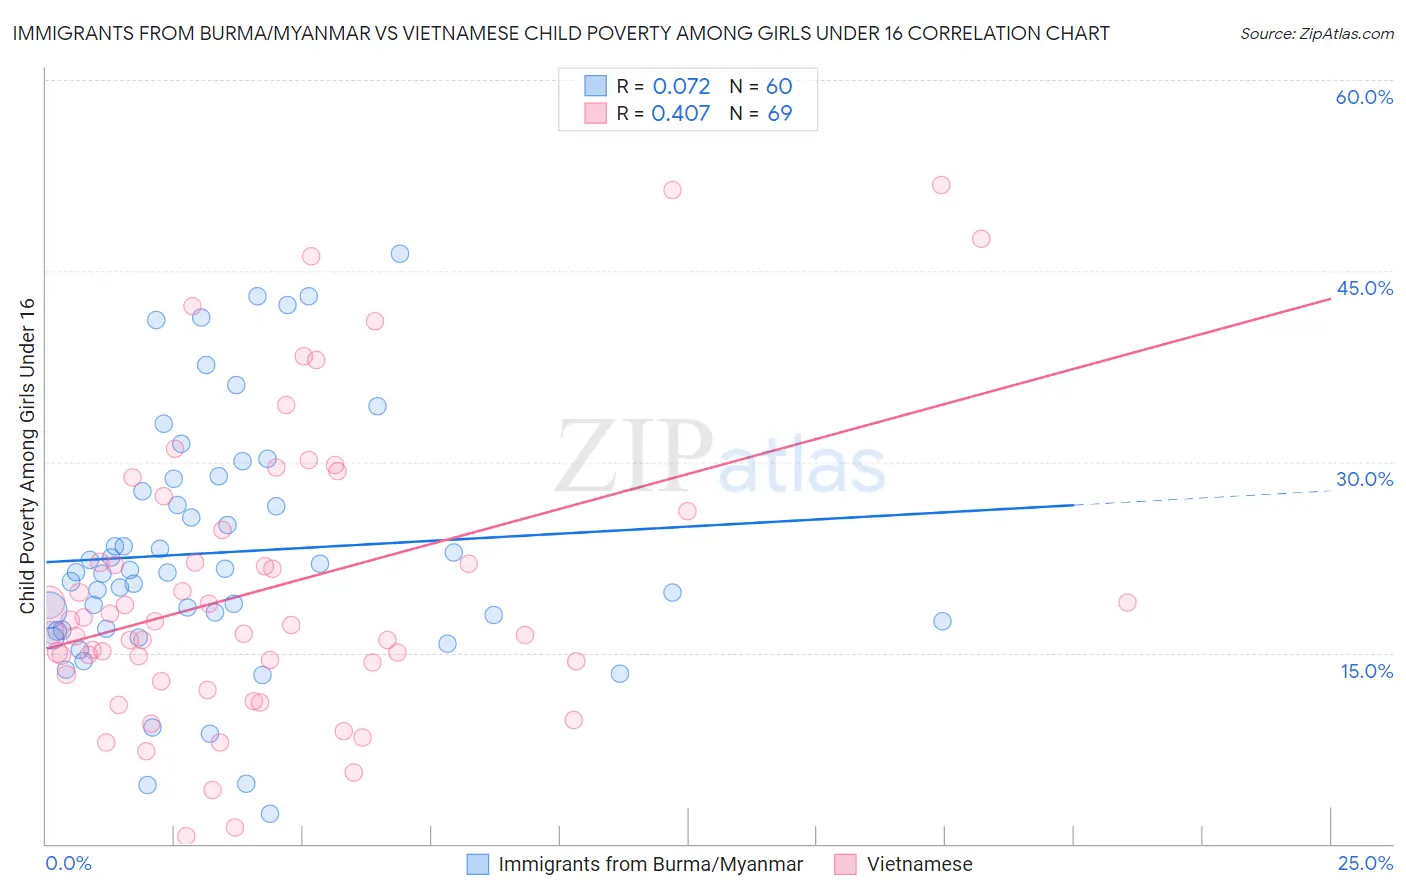
Immigrants from Burma/Myanmar vs Vietnamese Child Poverty Among Girls Under 16 Correlation Chart
The statistical analysis conducted on geographies consisting of 171,314,944 people shows a slight positive correlation between the proportion of Immigrants from Burma/Myanmar and poverty level among girls under the age of 16 in the United States with a correlation coefficient (R) of 0.072 and weighted average of 19.7%. Similarly, the statistical analysis conducted on geographies consisting of 169,480,173 people shows a moderate positive correlation between the proportion of Vietnamese and poverty level among girls under the age of 16 in the United States with a correlation coefficient (R) of 0.407 and weighted average of 19.5%, a difference of 0.64%.
Child Poverty Among Girls Under 16 Correlation Summary
| Measurement | Immigrants from Burma/Myanmar | Vietnamese |
| Minimum | 2.4% | 0.61% |
| Maximum | 46.4% | 51.8% |
| Range | 44.0% | 51.2% |
| Mean | 22.9% | 20.1% |
| Median | 21.3% | 17.1% |
| Interquartile 25% (IQ1) | 16.8% | 13.8% |
| Interquartile 75% (IQ3) | 28.2% | 25.3% |
| Interquartile Range (IQR) | 11.3% | 11.6% |
| Standard Deviation (Sample) | 9.8% | 11.4% |
| Standard Deviation (Population) | 9.7% | 11.3% |
Demographics Similar to Immigrants from Burma/Myanmar and Vietnamese by Child Poverty Among Girls Under 16
In terms of child poverty among girls under 16, the demographic groups most similar to Immigrants from Burma/Myanmar are Jamaican (19.7%, a difference of 0.11%), Chickasaw (19.6%, a difference of 0.12%), Immigrants from Jamaica (19.8%, a difference of 0.55%), Mexican American Indian (19.5%, a difference of 0.73%), and Spanish American (19.8%, a difference of 0.79%). Similarly, the demographic groups most similar to Vietnamese are Mexican American Indian (19.5%, a difference of 0.090%), Chickasaw (19.6%, a difference of 0.52%), Ottawa (19.4%, a difference of 0.67%), Jamaican (19.7%, a difference of 0.76%), and Salvadoran (19.4%, a difference of 0.77%).
| Demographics | Rating | Rank | Child Poverty Among Girls Under 16 |
| Immigrants | Middle Africa | 0.3 /100 | #252 | Tragic 19.2% |
| Immigrants | Guyana | 0.3 /100 | #253 | Tragic 19.3% |
| Immigrants | Western Africa | 0.3 /100 | #254 | Tragic 19.3% |
| Immigrants | Ecuador | 0.3 /100 | #255 | Tragic 19.3% |
| Trinidadians and Tobagonians | 0.2 /100 | #256 | Tragic 19.3% |
| Guyanese | 0.2 /100 | #257 | Tragic 19.4% |
| Salvadorans | 0.2 /100 | #258 | Tragic 19.4% |
| Ottawa | 0.2 /100 | #259 | Tragic 19.4% |
| Mexican American Indians | 0.2 /100 | #260 | Tragic 19.5% |
| Vietnamese | 0.2 /100 | #261 | Tragic 19.5% |
| Chickasaw | 0.1 /100 | #262 | Tragic 19.6% |
| Immigrants | Burma/Myanmar | 0.1 /100 | #263 | Tragic 19.7% |
| Jamaicans | 0.1 /100 | #264 | Tragic 19.7% |
| Immigrants | Jamaica | 0.1 /100 | #265 | Tragic 19.8% |
| Spanish Americans | 0.1 /100 | #266 | Tragic 19.8% |
| Immigrants | Bangladesh | 0.1 /100 | #267 | Tragic 19.9% |
| Spanish American Indians | 0.1 /100 | #268 | Tragic 19.9% |
| Liberians | 0.1 /100 | #269 | Tragic 19.9% |
| Cherokee | 0.1 /100 | #270 | Tragic 19.9% |
| Immigrants | Barbados | 0.1 /100 | #271 | Tragic 19.9% |
| Immigrants | El Salvador | 0.1 /100 | #272 | Tragic 20.0% |