Immigrants from Burma/Myanmar vs Panamanian Single Mother Poverty
COMPARE
Immigrants from Burma/Myanmar
Panamanian
Single Mother Poverty
Single Mother Poverty Comparison
Immigrants from Burma/Myanmar
Panamanians
30.6%
SINGLE MOTHER POVERTY
1.7/ 100
METRIC RATING
242nd/ 347
METRIC RANK
29.6%
SINGLE MOTHER POVERTY
20.0/ 100
METRIC RATING
200th/ 347
METRIC RANK
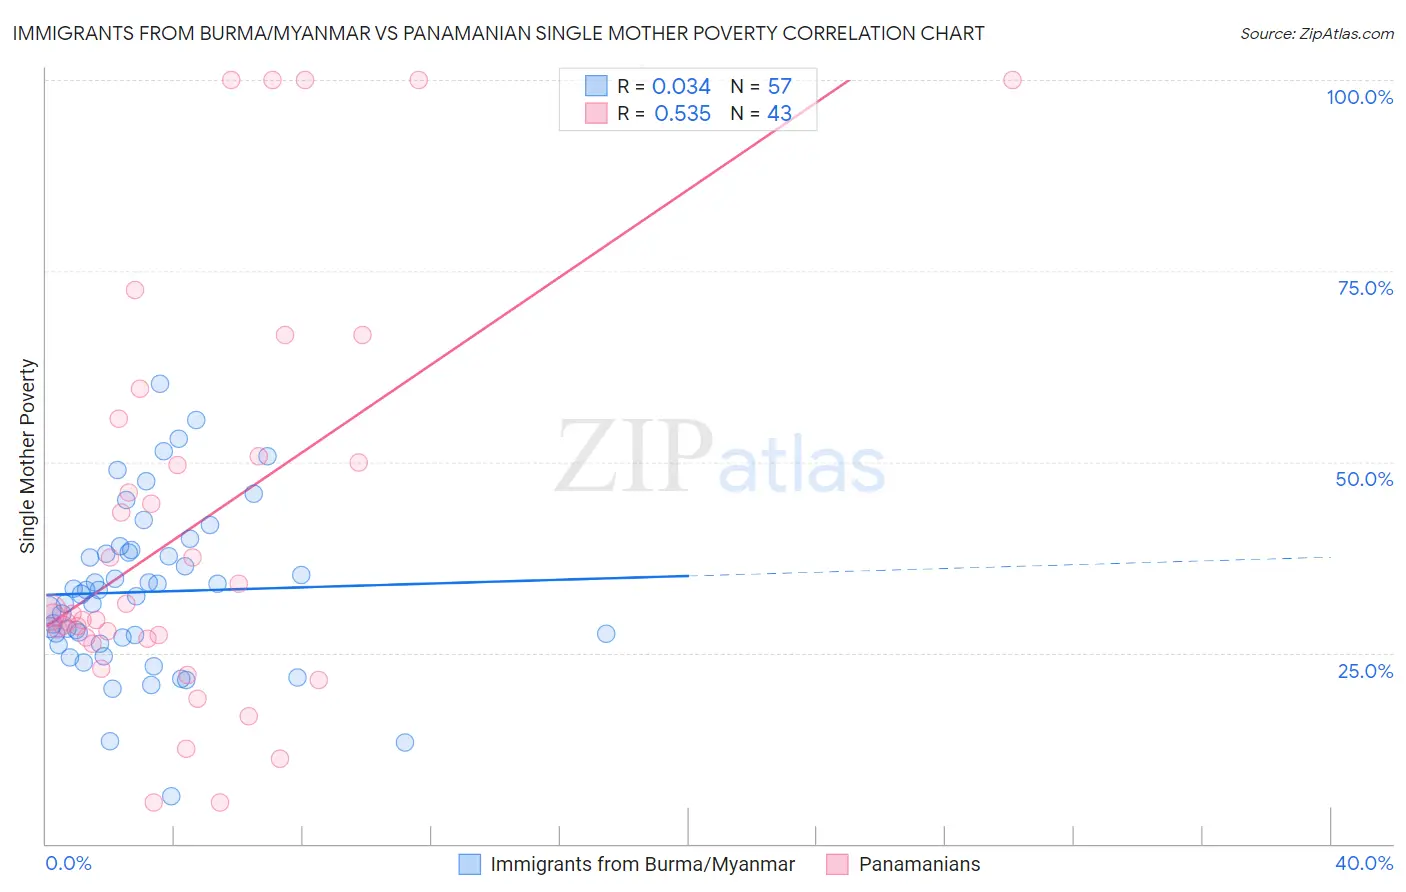
Immigrants from Burma/Myanmar vs Panamanian Single Mother Poverty Correlation Chart
The statistical analysis conducted on geographies consisting of 170,565,038 people shows no correlation between the proportion of Immigrants from Burma/Myanmar and poverty level among single mothers in the United States with a correlation coefficient (R) of 0.034 and weighted average of 30.6%. Similarly, the statistical analysis conducted on geographies consisting of 277,785,222 people shows a substantial positive correlation between the proportion of Panamanians and poverty level among single mothers in the United States with a correlation coefficient (R) of 0.535 and weighted average of 29.6%, a difference of 3.1%.
Single Mother Poverty Correlation Summary
| Measurement | Immigrants from Burma/Myanmar | Panamanian |
| Minimum | 6.2% | 5.3% |
| Maximum | 60.3% | 100.0% |
| Range | 54.0% | 94.7% |
| Mean | 33.0% | 41.4% |
| Median | 32.7% | 30.1% |
| Interquartile 25% (IQ1) | 26.6% | 26.9% |
| Interquartile 75% (IQ3) | 38.3% | 50.7% |
| Interquartile Range (IQR) | 11.7% | 23.8% |
| Standard Deviation (Sample) | 10.6% | 26.4% |
| Standard Deviation (Population) | 10.5% | 26.1% |
Similar Demographics by Single Mother Poverty
Demographics Similar to Immigrants from Burma/Myanmar by Single Mother Poverty
In terms of single mother poverty, the demographic groups most similar to Immigrants from Burma/Myanmar are Immigrants from Laos (30.6%, a difference of 0.020%), Salvadoran (30.6%, a difference of 0.070%), Bermudan (30.6%, a difference of 0.080%), Immigrants from Portugal (30.5%, a difference of 0.20%), and French (30.7%, a difference of 0.30%).
| Demographics | Rating | Rank | Single Mother Poverty |
| Immigrants | Grenada | 3.4 /100 | #235 | Tragic 30.3% |
| Welsh | 3.2 /100 | #236 | Tragic 30.4% |
| Immigrants | St. Vincent and the Grenadines | 3.1 /100 | #237 | Tragic 30.4% |
| Slovaks | 2.8 /100 | #238 | Tragic 30.4% |
| Immigrants | Portugal | 2.1 /100 | #239 | Tragic 30.5% |
| Salvadorans | 1.8 /100 | #240 | Tragic 30.6% |
| Immigrants | Laos | 1.8 /100 | #241 | Tragic 30.6% |
| Immigrants | Burma/Myanmar | 1.7 /100 | #242 | Tragic 30.6% |
| Bermudans | 1.6 /100 | #243 | Tragic 30.6% |
| French | 1.3 /100 | #244 | Tragic 30.7% |
| Barbadians | 1.3 /100 | #245 | Tragic 30.7% |
| Ecuadorians | 0.9 /100 | #246 | Tragic 30.8% |
| West Indians | 0.9 /100 | #247 | Tragic 30.8% |
| French Canadians | 0.9 /100 | #248 | Tragic 30.8% |
| Cape Verdeans | 0.8 /100 | #249 | Tragic 30.8% |
Demographics Similar to Panamanians by Single Mother Poverty
In terms of single mother poverty, the demographic groups most similar to Panamanians are Cuban (29.6%, a difference of 0.050%), Belgian (29.7%, a difference of 0.10%), Trinidadian and Tobagonian (29.6%, a difference of 0.12%), Immigrants from Jamaica (29.6%, a difference of 0.14%), and Malaysian (29.7%, a difference of 0.20%).
| Demographics | Rating | Rank | Single Mother Poverty |
| Basques | 28.3 /100 | #193 | Fair 29.5% |
| Icelanders | 26.1 /100 | #194 | Fair 29.5% |
| Slavs | 24.5 /100 | #195 | Fair 29.6% |
| Spanish American Indians | 23.4 /100 | #196 | Fair 29.6% |
| Immigrants | Jamaica | 22.0 /100 | #197 | Fair 29.6% |
| Trinidadians and Tobagonians | 21.7 /100 | #198 | Fair 29.6% |
| Cubans | 20.8 /100 | #199 | Fair 29.6% |
| Panamanians | 20.0 /100 | #200 | Fair 29.6% |
| Belgians | 18.8 /100 | #201 | Poor 29.7% |
| Malaysians | 17.4 /100 | #202 | Poor 29.7% |
| Swiss | 17.2 /100 | #203 | Poor 29.7% |
| Immigrants | Immigrants | 16.6 /100 | #204 | Poor 29.7% |
| Czechoslovakians | 16.1 /100 | #205 | Poor 29.7% |
| Immigrants | Haiti | 15.8 /100 | #206 | Poor 29.7% |
| Immigrants | Panama | 15.5 /100 | #207 | Poor 29.8% |