Immigrants from Bulgaria vs Immigrants from Micronesia Child Poverty Under the Age of 5

COMPARE

Immigrants from Bulgaria
Race
Ancestry
AfghanAfricanAlaska NativeAlaskan AthabascanAlbanianAleutAlsatianAmericanApacheArabArapahoArgentineanArmenianAssyrian/Chaldean/SyriacAustralianAustrianBahamianBangladeshiBarbadianBasqueBelgianBelizeanBermudanBhutaneseBlackfeetBolivianBrazilianBritishBritish West IndianBulgarianBurmeseCajunCambodianCanadianCape VerdeanCarpatho RusynCelticCentral AmericanCentral American IndianCherokeeCheyenneChickasawChileanChineseChippewaChoctawColombianColvilleComancheCosta RicanCreeCreekCroatianCrowCubanCypriotCzechCzechoslovakianDanishDelawareDominicanDutchDutch West IndianEastern EuropeanEcuadorianEgyptianEnglishEstonianEthiopianEuropeanFijianFilipinoFinnishFrenchFrench American IndianFrench CanadianGermanGerman RussianGhanaianGreekGuamanian/ChamorroGuatemalanGuyaneseHaitianHmongHonduranHopiHoumaHungarianIcelanderIndian (Asian)IndonesianInupiatIranianIraqiIrishIroquoisIsraeliItalianJamaicanJapaneseJordanianKenyanKiowaKoreanLaotianLatvianLebaneseLiberianLithuanianLumbeeLuxembourgerMacedonianMalaysianMalteseMarshalleseMenomineeMexicanMexican American IndianMongolianMoroccanNative HawaiianNavajoNepaleseNew ZealanderNicaraguanNigerianNorthern EuropeanNorwegianOkinawanOsageOttawaPaiutePakistaniPalestinianPanamanianParaguayanPennsylvania GermanPeruvianPimaPolishPortuguesePotawatomiPuebloPuerto RicanPuget Sound SalishRomanianRussianSalvadoranSamoanScandinavianScotch-IrishScottishSeminoleSenegaleseSerbianShoshoneSierra LeoneanSiouxSlavicSlovakSloveneSomaliSouth AfricanSouth AmericanSouth American IndianSoviet UnionSpaniardSpanishSpanish AmericanSpanish American IndianSri LankanSubsaharan AfricanSudaneseSwedishSwissSyrianTaiwaneseThaiTlingit-HaidaTohono O'OdhamTonganTrinidadian and TobagonianTsimshianTurkishU.S. Virgin IslanderUgandanUkrainianUruguayanUteVenezuelanVietnameseWelshWest IndianYakamaYaquiYugoslavianYumanYup'ikZimbabwean
Immigration
NonimmigrantsImmigrantsAfghanistanAfricaAlbaniaArgentinaArmeniaAsiaAustraliaAustriaBahamasBangladeshBarbadosBelarusBelgiumBelizeBoliviaBosnia and HerzegovinaBrazilBulgariaBurma/MyanmarCabo VerdeCambodiaCameroonCanadaCaribbeanCentral AmericaChileChinaColombiaCongoCosta RicaCroatiaCubaCzechoslovakiaDenmarkDominicaDominican RepublicEastern AfricaEastern AsiaEastern EuropeEcuadorEgyptEl SalvadorEnglandEritreaEthiopiaEuropeFijiFranceGermanyGhanaGreeceGrenadaGuatemalaGuyanaHaitiHondurasHong KongHungaryIndiaIndonesiaIranIraqIrelandIsraelItalyJamaicaJapanJordanKazakhstanKenyaKoreaKuwaitLaosLatin AmericaLatviaLebanonLiberiaLithuaniaMalaysiaMexicoMiddle AfricaMoldovaMoroccoNepalNetherlandsNicaraguaNigeriaNorth AmericaNorth MacedoniaNorthern AfricaNorthern EuropeNorwayOceaniaPakistanPanamaPeruPhilippinesPolandPortugalRomaniaRussiaSaudi ArabiaScotlandSenegalSerbiaSierra LeoneSingaporeSomaliaSouth AfricaSouth AmericaSouth Central AsiaSouth Eastern AsiaSouthern EuropeSpainSri LankaSt. Vincent and the GrenadinesSudanSwedenSwitzerlandSyriaTaiwanThailandTrinidad and TobagoTurkeyUgandaUkraineUruguayUzbekistanVenezuelaVietnamWest IndiesWestern AfricaWestern AsiaWestern EuropeYemenZaireZimbabweAzores
Immigrants from Micronesia
Race
Ancestry
AfghanAfricanAlaska NativeAlaskan AthabascanAlbanianAleutAlsatianAmericanApacheArabArapahoArgentineanArmenianAssyrian/Chaldean/SyriacAustralianAustrianBahamianBangladeshiBarbadianBasqueBelgianBelizeanBermudanBhutaneseBlackfeetBolivianBrazilianBritishBritish West IndianBulgarianBurmeseCajunCambodianCanadianCape VerdeanCarpatho RusynCelticCentral AmericanCentral American IndianCherokeeCheyenneChickasawChileanChineseChippewaChoctawColombianColvilleComancheCosta RicanCreeCreekCroatianCrowCubanCypriotCzechCzechoslovakianDanishDelawareDominicanDutchDutch West IndianEastern EuropeanEcuadorianEgyptianEnglishEstonianEthiopianEuropeanFijianFilipinoFinnishFrenchFrench American IndianFrench CanadianGermanGerman RussianGhanaianGreekGuamanian/ChamorroGuatemalanGuyaneseHaitianHmongHonduranHopiHoumaHungarianIcelanderIndian (Asian)IndonesianInupiatIranianIraqiIrishIroquoisIsraeliItalianJamaicanJapaneseJordanianKenyanKiowaKoreanLaotianLatvianLebaneseLiberianLithuanianLumbeeLuxembourgerMacedonianMalaysianMalteseMarshalleseMenomineeMexicanMexican American IndianMongolianMoroccanNative HawaiianNavajoNepaleseNew ZealanderNicaraguanNigerianNorthern EuropeanNorwegianOkinawanOsageOttawaPaiutePakistaniPalestinianPanamanianParaguayanPennsylvania GermanPeruvianPimaPolishPortuguesePotawatomiPuebloPuerto RicanPuget Sound SalishRomanianRussianSalvadoranSamoanScandinavianScotch-IrishScottishSeminoleSenegaleseSerbianShoshoneSierra LeoneanSiouxSlavicSlovakSloveneSomaliSouth AfricanSouth AmericanSouth American IndianSoviet UnionSpaniardSpanishSpanish AmericanSpanish American IndianSri LankanSubsaharan AfricanSudaneseSwedishSwissSyrianTaiwaneseThaiTlingit-HaidaTohono O'OdhamTonganTrinidadian and TobagonianTsimshianTurkishU.S. Virgin IslanderUgandanUkrainianUruguayanUteVenezuelanVietnameseWelshWest IndianYakamaYaquiYugoslavianYumanYup'ikZimbabwean
Immigration
NonimmigrantsImmigrantsAfghanistanAfricaAlbaniaArgentinaArmeniaAsiaAustraliaAustriaBahamasBangladeshBarbadosBelarusBelgiumBelizeBoliviaBosnia and HerzegovinaBrazilBurma/MyanmarCabo VerdeCambodiaCameroonCanadaCaribbeanCentral AmericaChileChinaColombiaCongoCosta RicaCroatiaCubaCzechoslovakiaDenmarkDominicaDominican RepublicEastern AfricaEastern AsiaEastern EuropeEcuadorEgyptEl SalvadorEnglandEritreaEthiopiaEuropeFijiFranceGermanyGhanaGreeceGrenadaGuatemalaGuyanaHaitiHondurasHong KongHungaryIndiaIndonesiaIranIraqIrelandIsraelItalyJamaicaJapanJordanKazakhstanKenyaKoreaKuwaitLaosLatin AmericaLatviaLebanonLiberiaLithuaniaMalaysiaMexicoMicronesiaMiddle AfricaMoldovaMoroccoNepalNetherlandsNicaraguaNigeriaNorth AmericaNorth MacedoniaNorthern AfricaNorthern EuropeNorwayOceaniaPakistanPanamaPeruPhilippinesPolandPortugalRomaniaRussiaSaudi ArabiaScotlandSenegalSerbiaSierra LeoneSingaporeSomaliaSouth AfricaSouth AmericaSouth Central AsiaSouth Eastern AsiaSouthern EuropeSpainSri LankaSt. Vincent and the GrenadinesSudanSwedenSwitzerlandSyriaTaiwanThailandTrinidad and TobagoTurkeyUgandaUkraineUruguayUzbekistanVenezuelaVietnamWest IndiesWestern AfricaWestern AsiaWestern EuropeYemenZaireZimbabweAzores
Child Poverty Under the Age of 5
Income
Poverty
Unemployment
Labor Participation
Family Structure
Vehicle Availability
Education Level
Disability

Child Poverty Under the Age of 5 Comparison

Immigrants from Bulgaria

Immigrants from Micronesia

Exceptional
Tragic
14.8%
CHILD POVERTY UNDER THE AGE OF 5
99.6/ 100
METRIC RATING
49th/ 347
METRIC RANK
19.4%
CHILD POVERTY UNDER THE AGE OF 5
0.9/ 100
METRIC RATING
234th/ 347
METRIC RANK

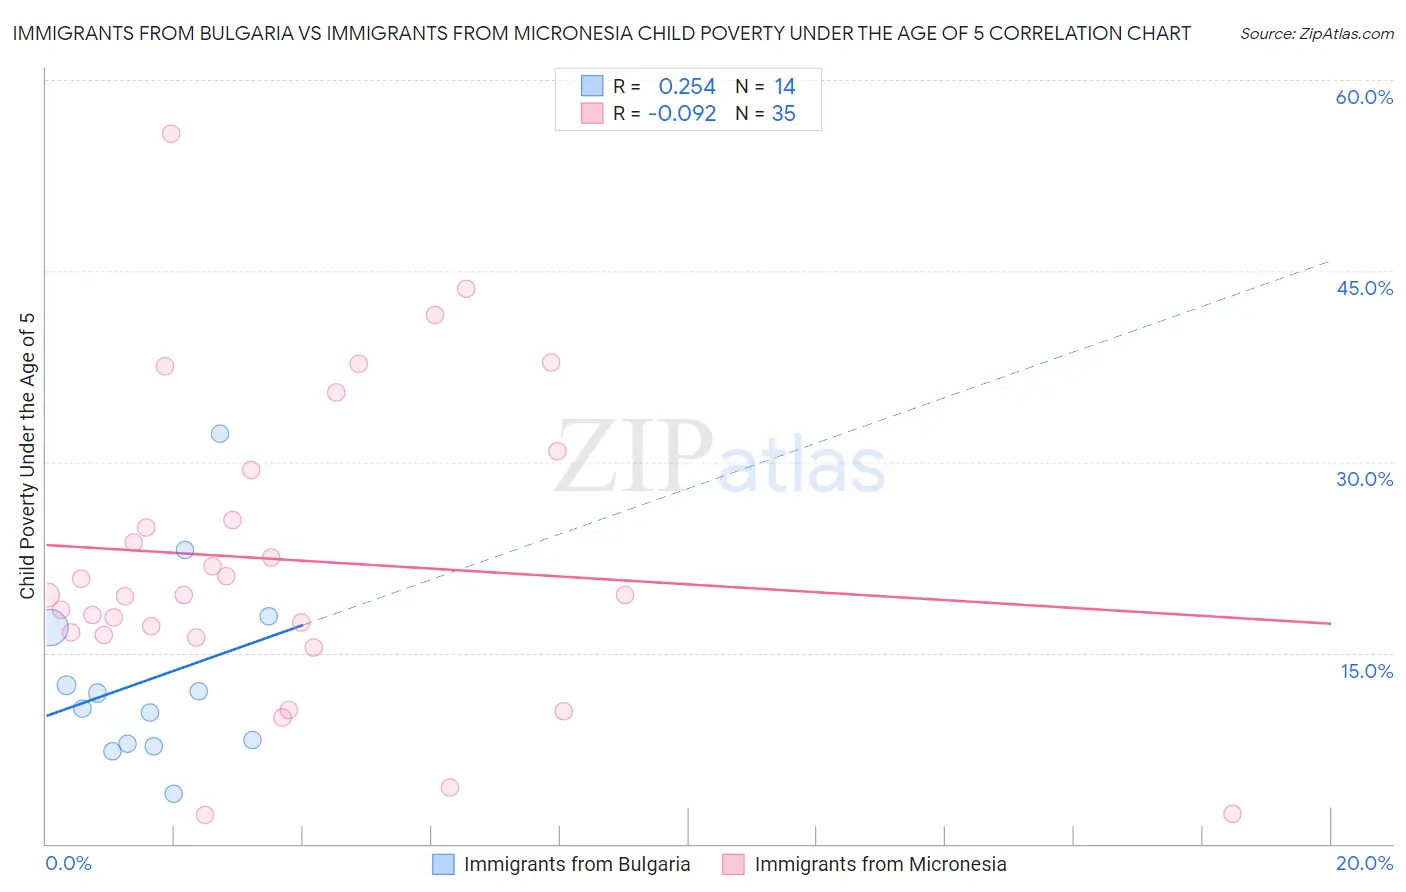
Immigrants from Bulgaria vs Immigrants from Micronesia Child Poverty Under the Age of 5 Correlation Chart

The statistical analysis conducted on geographies consisting of 167,925,636 people shows a weak positive correlation between the proportion of Immigrants from Bulgaria and poverty level among children under the age of 5 in the United States with a correlation coefficient (R) of 0.254 and weighted average of 14.8%. Similarly, the statistical analysis conducted on geographies consisting of 61,294,346 people shows a slight negative correlation between the proportion of Immigrants from Micronesia and poverty level among children under the age of 5 in the United States with a correlation coefficient (R) of -0.092 and weighted average of 19.4%, a difference of 30.9%.
Immigrants from Bulgaria vs Immigrants from Micronesia Child Poverty Under the Age of 5

Child Poverty Under the Age of 5 Correlation Summary

MeasurementImmigrants from BulgariaImmigrants from Micronesia
Minimum4.0%2.3%
Maximum32.2%55.8%
Range28.3%53.5%
Mean13.0%22.3%
Median11.2%19.5%
Interquartile 25% (IQ1)7.9%16.4%
Interquartile 75% (IQ3)17.0%29.4%
Interquartile Range (IQR)9.1%12.9%
Standard Deviation (Sample)7.4%11.9%
Standard Deviation (Population)7.2%11.7%

Similar Demographics by Child Poverty Under the Age of 5

Demographics Similar to Immigrants from Bulgaria by Child Poverty Under the Age of 5

In terms of child poverty under the age of 5, the demographic groups most similar to Immigrants from Bulgaria are Immigrants from Northern Europe (14.8%, a difference of 0.090%), Estonian (14.8%, a difference of 0.14%), Immigrants from Czechoslovakia (14.8%, a difference of 0.15%), Russian (14.8%, a difference of 0.26%), and Tsimshian (14.7%, a difference of 0.39%).
DemographicsRating | RankChild Poverty Under the Age of 5
Soviet Union
99.7
/100
|
#42
Exceptional
14.7%
Immigrants | Greece
99.7
/100
|
#43
Exceptional
14.7%
Immigrants | Philippines
99.7
/100
|
#44
Exceptional
14.7%
Laotians
99.6
/100
|
#45
Exceptional
14.7%
Tsimshian
99.6
/100
|
#46
Exceptional
14.7%
Russians
99.6
/100
|
#47
Exceptional
14.8%
Immigrants | Czechoslovakia
99.6
/100
|
#48
Exceptional
14.8%
Immigrants | Bulgaria
99.6
/100
|
#49
Exceptional
14.8%
Immigrants | Northern Europe
99.6
/100
|
#50
Exceptional
14.8%
Estonians
99.6
/100
|
#51
Exceptional
14.8%
Immigrants | Serbia
99.5
/100
|
#52
Exceptional
14.9%
Luxembourgers
99.4
/100
|
#53
Exceptional
14.9%
Immigrants | Israel
99.4
/100
|
#54
Exceptional
14.9%
Danes
99.4
/100
|
#55
Exceptional
14.9%
Immigrants | Pakistan
99.4
/100
|
#56
Exceptional
14.9%

Demographics Similar to Immigrants from Micronesia by Child Poverty Under the Age of 5

In terms of child poverty under the age of 5, the demographic groups most similar to Immigrants from Micronesia are Sudanese (19.3%, a difference of 0.12%), Trinidadian and Tobagonian (19.3%, a difference of 0.18%), Immigrants from Laos (19.4%, a difference of 0.21%), Immigrants from Trinidad and Tobago (19.4%, a difference of 0.21%), and Bermudan (19.2%, a difference of 0.74%).
DemographicsRating | RankChild Poverty Under the Age of 5
Cape Verdeans
1.4
/100
|
#227
Tragic
19.1%
Immigrants | Sudan
1.3
/100
|
#228
Tragic
19.2%
Ghanaians
1.2
/100
|
#229
Tragic
19.2%
Ecuadorians
1.2
/100
|
#230
Tragic
19.2%
Bermudans
1.2
/100
|
#231
Tragic
19.2%
Trinidadians and Tobagonians
0.9
/100
|
#232
Tragic
19.3%
Sudanese
0.9
/100
|
#233
Tragic
19.3%
Immigrants | Micronesia
0.9
/100
|
#234
Tragic
19.4%
Immigrants | Laos
0.8
/100
|
#235
Tragic
19.4%
Immigrants | Trinidad and Tobago
0.8
/100
|
#236
Tragic
19.4%
Immigrants | Cabo Verde
0.6
/100
|
#237
Tragic
19.5%
Salvadorans
0.6
/100
|
#238
Tragic
19.5%
Vietnamese
0.6
/100
|
#239
Tragic
19.5%
Immigrants | Ecuador
0.5
/100
|
#240
Tragic
19.6%
Alaska Natives
0.5
/100
|
#241
Tragic
19.6%