Immigrants from Bulgaria vs Immigrants from Germany Poverty

COMPARE

Immigrants from Bulgaria
Race
Ancestry
AfghanAfricanAlaska NativeAlaskan AthabascanAlbanianAleutAlsatianAmericanApacheArabArapahoArgentineanArmenianAssyrian/Chaldean/SyriacAustralianAustrianBahamianBangladeshiBarbadianBasqueBelgianBelizeanBermudanBhutaneseBlackfeetBolivianBrazilianBritishBritish West IndianBulgarianBurmeseCajunCambodianCanadianCape VerdeanCarpatho RusynCelticCentral AmericanCentral American IndianCherokeeCheyenneChickasawChileanChineseChippewaChoctawColombianColvilleComancheCosta RicanCreeCreekCroatianCrowCubanCypriotCzechCzechoslovakianDanishDelawareDominicanDutchDutch West IndianEastern EuropeanEcuadorianEgyptianEnglishEstonianEthiopianEuropeanFijianFilipinoFinnishFrenchFrench American IndianFrench CanadianGermanGerman RussianGhanaianGreekGuamanian/ChamorroGuatemalanGuyaneseHaitianHmongHonduranHopiHoumaHungarianIcelanderIndian (Asian)IndonesianInupiatIranianIraqiIrishIroquoisIsraeliItalianJamaicanJapaneseJordanianKenyanKiowaKoreanLaotianLatvianLebaneseLiberianLithuanianLumbeeLuxembourgerMacedonianMalaysianMalteseMarshalleseMenomineeMexicanMexican American IndianMongolianMoroccanNative HawaiianNavajoNepaleseNew ZealanderNicaraguanNigerianNorthern EuropeanNorwegianOkinawanOsageOttawaPaiutePakistaniPalestinianPanamanianParaguayanPennsylvania GermanPeruvianPimaPolishPortuguesePotawatomiPuebloPuerto RicanPuget Sound SalishRomanianRussianSalvadoranSamoanScandinavianScotch-IrishScottishSeminoleSenegaleseSerbianShoshoneSierra LeoneanSiouxSlavicSlovakSloveneSomaliSouth AfricanSouth AmericanSouth American IndianSoviet UnionSpaniardSpanishSpanish AmericanSpanish American IndianSri LankanSubsaharan AfricanSudaneseSwedishSwissSyrianTaiwaneseThaiTlingit-HaidaTohono O'OdhamTonganTrinidadian and TobagonianTsimshianTurkishU.S. Virgin IslanderUgandanUkrainianUruguayanUteVenezuelanVietnameseWelshWest IndianYakamaYaquiYugoslavianYumanYup'ikZimbabwean
Immigration
NonimmigrantsImmigrantsAfghanistanAfricaAlbaniaArgentinaArmeniaAsiaAustraliaAustriaBahamasBangladeshBarbadosBelarusBelgiumBelizeBoliviaBosnia and HerzegovinaBrazilBulgariaBurma/MyanmarCabo VerdeCambodiaCameroonCanadaCaribbeanCentral AmericaChileChinaColombiaCongoCosta RicaCroatiaCubaCzechoslovakiaDenmarkDominicaDominican RepublicEastern AfricaEastern AsiaEastern EuropeEcuadorEgyptEl SalvadorEnglandEritreaEthiopiaEuropeFijiFranceGhanaGreeceGrenadaGuatemalaGuyanaHaitiHondurasHong KongHungaryIndiaIndonesiaIranIraqIrelandIsraelItalyJamaicaJapanJordanKazakhstanKenyaKoreaKuwaitLaosLatin AmericaLatviaLebanonLiberiaLithuaniaMalaysiaMexicoMicronesiaMiddle AfricaMoldovaMoroccoNepalNetherlandsNicaraguaNigeriaNorth AmericaNorth MacedoniaNorthern AfricaNorthern EuropeNorwayOceaniaPakistanPanamaPeruPhilippinesPolandPortugalRomaniaRussiaSaudi ArabiaScotlandSenegalSerbiaSierra LeoneSingaporeSomaliaSouth AfricaSouth AmericaSouth Central AsiaSouth Eastern AsiaSouthern EuropeSpainSri LankaSt. Vincent and the GrenadinesSudanSwedenSwitzerlandSyriaTaiwanThailandTrinidad and TobagoTurkeyUgandaUkraineUruguayUzbekistanVenezuelaVietnamWest IndiesWestern AfricaWestern AsiaWestern EuropeYemenZaireZimbabweAzores
Immigrants from Germany
Race
Ancestry
AfghanAfricanAlaska NativeAlaskan AthabascanAlbanianAleutAlsatianAmericanApacheArabArapahoArgentineanArmenianAssyrian/Chaldean/SyriacAustralianAustrianBahamianBangladeshiBarbadianBasqueBelgianBelizeanBermudanBhutaneseBlackfeetBolivianBrazilianBritishBritish West IndianBulgarianBurmeseCajunCambodianCanadianCape VerdeanCarpatho RusynCelticCentral AmericanCentral American IndianCherokeeCheyenneChickasawChileanChineseChippewaChoctawColombianColvilleComancheCosta RicanCreeCreekCroatianCrowCubanCypriotCzechCzechoslovakianDanishDelawareDominicanDutchDutch West IndianEastern EuropeanEcuadorianEgyptianEnglishEstonianEthiopianEuropeanFijianFilipinoFinnishFrenchFrench American IndianFrench CanadianGermanGerman RussianGhanaianGreekGuamanian/ChamorroGuatemalanGuyaneseHaitianHmongHonduranHopiHoumaHungarianIcelanderIndian (Asian)IndonesianInupiatIranianIraqiIrishIroquoisIsraeliItalianJamaicanJapaneseJordanianKenyanKiowaKoreanLaotianLatvianLebaneseLiberianLithuanianLumbeeLuxembourgerMacedonianMalaysianMalteseMarshalleseMenomineeMexicanMexican American IndianMongolianMoroccanNative HawaiianNavajoNepaleseNew ZealanderNicaraguanNigerianNorthern EuropeanNorwegianOkinawanOsageOttawaPaiutePakistaniPalestinianPanamanianParaguayanPennsylvania GermanPeruvianPimaPolishPortuguesePotawatomiPuebloPuerto RicanPuget Sound SalishRomanianRussianSalvadoranSamoanScandinavianScotch-IrishScottishSeminoleSenegaleseSerbianShoshoneSierra LeoneanSiouxSlavicSlovakSloveneSomaliSouth AfricanSouth AmericanSouth American IndianSoviet UnionSpaniardSpanishSpanish AmericanSpanish American IndianSri LankanSubsaharan AfricanSudaneseSwedishSwissSyrianTaiwaneseThaiTlingit-HaidaTohono O'OdhamTonganTrinidadian and TobagonianTsimshianTurkishU.S. Virgin IslanderUgandanUkrainianUruguayanUteVenezuelanVietnameseWelshWest IndianYakamaYaquiYugoslavianYumanYup'ikZimbabwean
Immigration
NonimmigrantsImmigrantsAfghanistanAfricaAlbaniaArgentinaArmeniaAsiaAustraliaAustriaBahamasBangladeshBarbadosBelarusBelgiumBelizeBoliviaBosnia and HerzegovinaBrazilBurma/MyanmarCabo VerdeCambodiaCameroonCanadaCaribbeanCentral AmericaChileChinaColombiaCongoCosta RicaCroatiaCubaCzechoslovakiaDenmarkDominicaDominican RepublicEastern AfricaEastern AsiaEastern EuropeEcuadorEgyptEl SalvadorEnglandEritreaEthiopiaEuropeFijiFranceGermanyGhanaGreeceGrenadaGuatemalaGuyanaHaitiHondurasHong KongHungaryIndiaIndonesiaIranIraqIrelandIsraelItalyJamaicaJapanJordanKazakhstanKenyaKoreaKuwaitLaosLatin AmericaLatviaLebanonLiberiaLithuaniaMalaysiaMexicoMicronesiaMiddle AfricaMoldovaMoroccoNepalNetherlandsNicaraguaNigeriaNorth AmericaNorth MacedoniaNorthern AfricaNorthern EuropeNorwayOceaniaPakistanPanamaPeruPhilippinesPolandPortugalRomaniaRussiaSaudi ArabiaScotlandSenegalSerbiaSierra LeoneSingaporeSomaliaSouth AfricaSouth AmericaSouth Central AsiaSouth Eastern AsiaSouthern EuropeSpainSri LankaSt. Vincent and the GrenadinesSudanSwedenSwitzerlandSyriaTaiwanThailandTrinidad and TobagoTurkeyUgandaUkraineUruguayUzbekistanVenezuelaVietnamWest IndiesWestern AfricaWestern AsiaWestern EuropeYemenZaireZimbabweAzores
Poverty
Income
Poverty
Unemployment
Labor Participation
Family Structure
Vehicle Availability
Education Level
Disability

Poverty Comparison

Immigrants from Bulgaria

Immigrants from Germany

Exceptional
Good
11.1%
POVERTY
98.5/ 100
METRIC RATING
54th/ 347
METRIC RANK
12.0%
POVERTY
72.7/ 100
METRIC RATING
148th/ 347
METRIC RANK

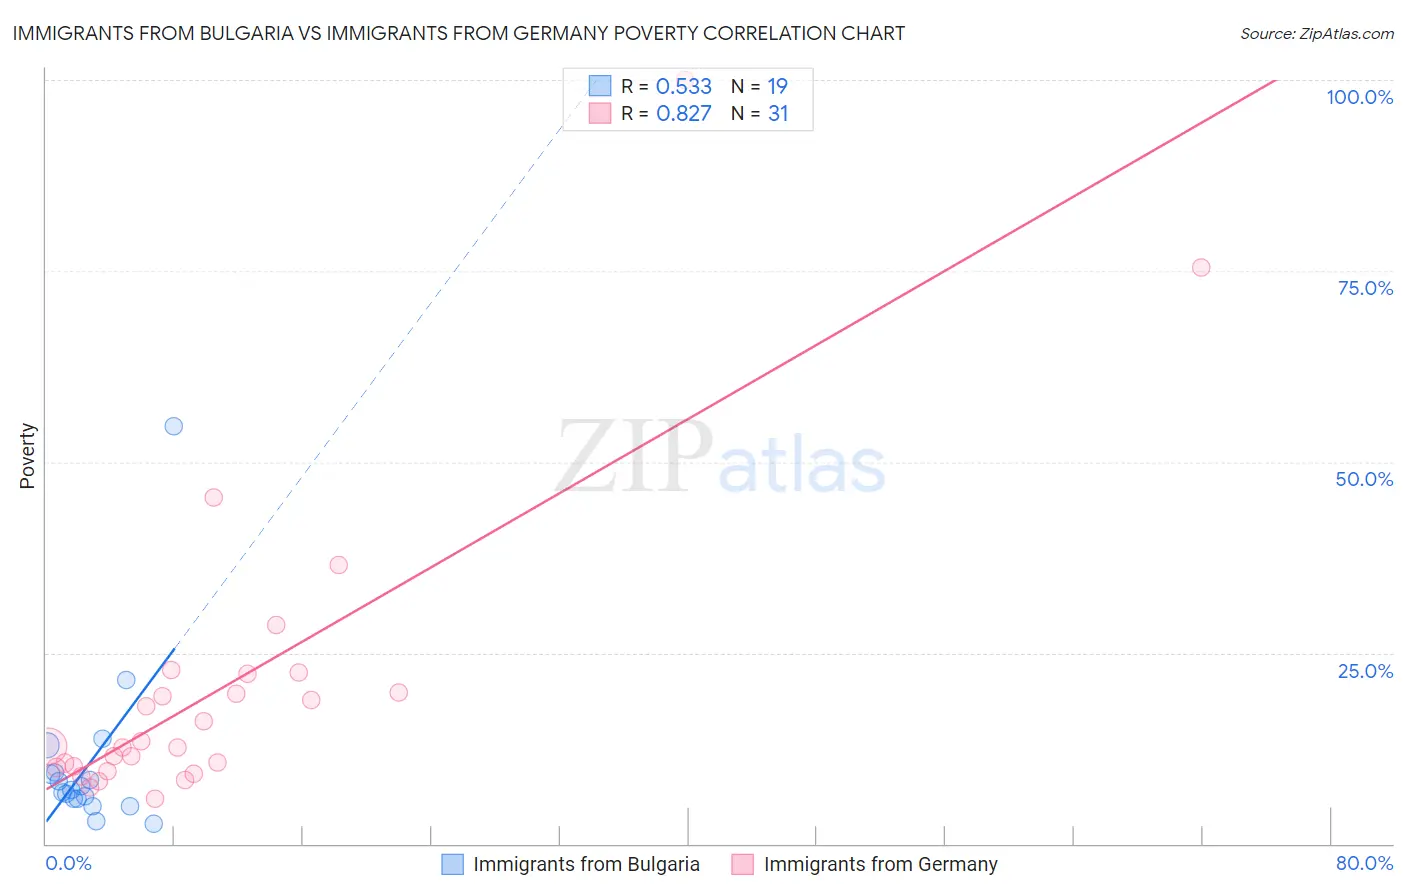
Immigrants from Bulgaria vs Immigrants from Germany Poverty Correlation Chart

The statistical analysis conducted on geographies consisting of 172,536,486 people shows a substantial positive correlation between the proportion of Immigrants from Bulgaria and poverty level in the United States with a correlation coefficient (R) of 0.533 and weighted average of 11.1%. Similarly, the statistical analysis conducted on geographies consisting of 463,719,504 people shows a very strong positive correlation between the proportion of Immigrants from Germany and poverty level in the United States with a correlation coefficient (R) of 0.827 and weighted average of 12.0%, a difference of 8.7%.
Immigrants from Bulgaria vs Immigrants from Germany Poverty

Poverty Correlation Summary

MeasurementImmigrants from BulgariaImmigrants from Germany
Minimum2.7%5.8%
Maximum54.7%100.0%
Range52.0%94.2%
Mean10.5%20.6%
Median7.0%12.7%
Interquartile 25% (IQ1)5.8%10.0%
Interquartile 75% (IQ3)9.4%22.3%
Interquartile Range (IQR)3.5%12.3%
Standard Deviation (Sample)11.5%20.2%
Standard Deviation (Population)11.2%19.8%

Similar Demographics by Poverty

Demographics Similar to Immigrants from Bulgaria by Poverty

In terms of poverty, the demographic groups most similar to Immigrants from Bulgaria are Immigrants from Serbia (11.1%, a difference of 0.030%), Immigrants from Austria (11.1%, a difference of 0.12%), Immigrants from Philippines (11.0%, a difference of 0.34%), Immigrants from Croatia (11.0%, a difference of 0.36%), and Estonian (11.1%, a difference of 0.51%).
DemographicsRating | RankPoverty
Immigrants | Romania
98.9
/100
|
#47
Exceptional
11.0%
Slovenes
98.9
/100
|
#48
Exceptional
11.0%
Immigrants | Japan
98.9
/100
|
#49
Exceptional
11.0%
Asians
98.9
/100
|
#50
Exceptional
11.0%
Immigrants | Croatia
98.7
/100
|
#51
Exceptional
11.0%
Immigrants | Philippines
98.7
/100
|
#52
Exceptional
11.0%
Immigrants | Austria
98.6
/100
|
#53
Exceptional
11.1%
Immigrants | Bulgaria
98.5
/100
|
#54
Exceptional
11.1%
Immigrants | Serbia
98.5
/100
|
#55
Exceptional
11.1%
Estonians
98.2
/100
|
#56
Exceptional
11.1%
Scandinavians
98.2
/100
|
#57
Exceptional
11.1%
Germans
98.1
/100
|
#58
Exceptional
11.1%
Immigrants | Europe
98.0
/100
|
#59
Exceptional
11.2%
Immigrants | Sri Lanka
97.9
/100
|
#60
Exceptional
11.2%
Immigrants | Italy
97.9
/100
|
#61
Exceptional
11.2%

Demographics Similar to Immigrants from Germany by Poverty

In terms of poverty, the demographic groups most similar to Immigrants from Germany are Immigrants from Malaysia (12.0%, a difference of 0.0%), Immigrants from Kazakhstan (12.0%, a difference of 0.050%), Samoan (12.0%, a difference of 0.10%), Immigrants from Bosnia and Herzegovina (12.0%, a difference of 0.12%), and Afghan (12.0%, a difference of 0.28%).
DemographicsRating | RankPoverty
Immigrants | France
80.5
/100
|
#141
Excellent
11.9%
Basques
80.4
/100
|
#142
Excellent
11.9%
Brazilians
79.7
/100
|
#143
Good
11.9%
Icelanders
77.9
/100
|
#144
Good
11.9%
Syrians
75.1
/100
|
#145
Good
12.0%
Afghans
74.9
/100
|
#146
Good
12.0%
Immigrants | Bosnia and Herzegovina
73.7
/100
|
#147
Good
12.0%
Immigrants | Germany
72.7
/100
|
#148
Good
12.0%
Immigrants | Malaysia
72.7
/100
|
#149
Good
12.0%
Immigrants | Kazakhstan
72.3
/100
|
#150
Good
12.0%
Samoans
71.9
/100
|
#151
Good
12.0%
Armenians
67.6
/100
|
#152
Good
12.1%
Immigrants | Northern Africa
63.9
/100
|
#153
Good
12.1%
Guamanians/Chamorros
63.9
/100
|
#154
Good
12.1%
Hungarians
63.6
/100
|
#155
Good
12.2%