Immigrants from Brazil vs Subsaharan African Child Poverty Among Boys Under 16

COMPARE

Immigrants from Brazil
Race
Ancestry
AfghanAfricanAlaska NativeAlaskan AthabascanAlbanianAleutAlsatianAmericanApacheArabArapahoArgentineanArmenianAssyrian/Chaldean/SyriacAustralianAustrianBahamianBangladeshiBarbadianBasqueBelgianBelizeanBermudanBhutaneseBlackfeetBolivianBrazilianBritishBritish West IndianBulgarianBurmeseCajunCambodianCanadianCape VerdeanCarpatho RusynCelticCentral AmericanCentral American IndianCherokeeCheyenneChickasawChileanChineseChippewaChoctawColombianColvilleComancheCosta RicanCreeCreekCroatianCrowCubanCypriotCzechCzechoslovakianDanishDelawareDominicanDutchDutch West IndianEastern EuropeanEcuadorianEgyptianEnglishEstonianEthiopianEuropeanFijianFilipinoFinnishFrenchFrench American IndianFrench CanadianGermanGerman RussianGhanaianGreekGuamanian/ChamorroGuatemalanGuyaneseHaitianHmongHonduranHopiHoumaHungarianIcelanderIndian (Asian)IndonesianInupiatIranianIraqiIrishIroquoisIsraeliItalianJamaicanJapaneseJordanianKenyanKiowaKoreanLaotianLatvianLebaneseLiberianLithuanianLumbeeLuxembourgerMacedonianMalaysianMalteseMarshalleseMenomineeMexicanMexican American IndianMongolianMoroccanNative HawaiianNavajoNepaleseNew ZealanderNicaraguanNigerianNorthern EuropeanNorwegianOkinawanOsageOttawaPaiutePakistaniPalestinianPanamanianParaguayanPennsylvania GermanPeruvianPimaPolishPortuguesePotawatomiPuebloPuerto RicanPuget Sound SalishRomanianRussianSalvadoranSamoanScandinavianScotch-IrishScottishSeminoleSenegaleseSerbianShoshoneSierra LeoneanSiouxSlavicSlovakSloveneSomaliSouth AfricanSouth AmericanSouth American IndianSoviet UnionSpaniardSpanishSpanish AmericanSpanish American IndianSri LankanSudaneseSwedishSwissSyrianTaiwaneseThaiTlingit-HaidaTohono O'OdhamTonganTrinidadian and TobagonianTsimshianTurkishU.S. Virgin IslanderUgandanUkrainianUruguayanUteVenezuelanVietnameseWelshWest IndianYakamaYaquiYugoslavianYumanYup'ikZimbabwean
Immigration
NonimmigrantsImmigrantsAfghanistanAfricaAlbaniaArgentinaArmeniaAsiaAustraliaAustriaBahamasBangladeshBarbadosBelarusBelgiumBelizeBoliviaBosnia and HerzegovinaBrazilBulgariaBurma/MyanmarCabo VerdeCambodiaCameroonCanadaCaribbeanCentral AmericaChileChinaColombiaCongoCosta RicaCroatiaCubaCzechoslovakiaDenmarkDominicaDominican RepublicEastern AfricaEastern AsiaEastern EuropeEcuadorEgyptEl SalvadorEnglandEritreaEthiopiaEuropeFijiFranceGermanyGhanaGreeceGrenadaGuatemalaGuyanaHaitiHondurasHong KongHungaryIndiaIndonesiaIranIraqIrelandIsraelItalyJamaicaJapanJordanKazakhstanKenyaKoreaKuwaitLaosLatin AmericaLatviaLebanonLiberiaLithuaniaMalaysiaMexicoMicronesiaMiddle AfricaMoldovaMoroccoNepalNetherlandsNicaraguaNigeriaNorth AmericaNorth MacedoniaNorthern AfricaNorthern EuropeNorwayOceaniaPakistanPanamaPeruPhilippinesPolandPortugalRomaniaRussiaSaudi ArabiaScotlandSenegalSerbiaSierra LeoneSingaporeSomaliaSouth AfricaSouth AmericaSouth Central AsiaSouth Eastern AsiaSouthern EuropeSpainSri LankaSt. Vincent and the GrenadinesSudanSwedenSwitzerlandSyriaTaiwanThailandTrinidad and TobagoTurkeyUgandaUkraineUruguayUzbekistanVenezuelaVietnamWest IndiesWestern AfricaWestern AsiaWestern EuropeYemenZaireZimbabweAzores
Subsaharan African
Race
Ancestry
AfghanAfricanAlaska NativeAlaskan AthabascanAlbanianAleutAlsatianAmericanApacheArabArapahoArgentineanArmenianAssyrian/Chaldean/SyriacAustralianAustrianBahamianBangladeshiBarbadianBasqueBelgianBelizeanBermudanBhutaneseBlackfeetBolivianBrazilianBritishBritish West IndianBulgarianBurmeseCajunCambodianCanadianCape VerdeanCarpatho RusynCelticCentral AmericanCentral American IndianCherokeeCheyenneChickasawChileanChineseChippewaChoctawColombianColvilleComancheCosta RicanCreeCreekCroatianCrowCubanCypriotCzechCzechoslovakianDanishDelawareDominicanDutchDutch West IndianEastern EuropeanEcuadorianEgyptianEnglishEstonianEthiopianEuropeanFijianFilipinoFinnishFrenchFrench American IndianFrench CanadianGermanGerman RussianGhanaianGreekGuamanian/ChamorroGuatemalanGuyaneseHaitianHmongHonduranHopiHoumaHungarianIcelanderIndian (Asian)IndonesianInupiatIranianIraqiIrishIroquoisIsraeliItalianJamaicanJapaneseJordanianKenyanKiowaKoreanLaotianLatvianLebaneseLiberianLithuanianLumbeeLuxembourgerMacedonianMalaysianMalteseMarshalleseMenomineeMexicanMexican American IndianMongolianMoroccanNative HawaiianNavajoNepaleseNew ZealanderNicaraguanNigerianNorthern EuropeanNorwegianOkinawanOsageOttawaPaiutePakistaniPalestinianPanamanianParaguayanPennsylvania GermanPeruvianPimaPolishPortuguesePotawatomiPuebloPuerto RicanPuget Sound SalishRomanianRussianSalvadoranSamoanScandinavianScotch-IrishScottishSeminoleSenegaleseSerbianShoshoneSierra LeoneanSiouxSlavicSlovakSloveneSomaliSouth AfricanSouth AmericanSouth American IndianSoviet UnionSpaniardSpanishSpanish AmericanSpanish American IndianSri LankanSubsaharan AfricanSudaneseSwedishSwissSyrianTaiwaneseThaiTlingit-HaidaTohono O'OdhamTonganTrinidadian and TobagonianTsimshianTurkishU.S. Virgin IslanderUgandanUkrainianUruguayanUteVenezuelanVietnameseWelshWest IndianYakamaYaquiYugoslavianYumanYup'ikZimbabwean
Immigration
NonimmigrantsImmigrantsAfghanistanAfricaAlbaniaArgentinaArmeniaAsiaAustraliaAustriaBahamasBangladeshBarbadosBelarusBelgiumBelizeBoliviaBosnia and HerzegovinaBulgariaBurma/MyanmarCabo VerdeCambodiaCameroonCanadaCaribbeanCentral AmericaChileChinaColombiaCongoCosta RicaCroatiaCubaCzechoslovakiaDenmarkDominicaDominican RepublicEastern AfricaEastern AsiaEastern EuropeEcuadorEgyptEl SalvadorEnglandEritreaEthiopiaEuropeFijiFranceGermanyGhanaGreeceGrenadaGuatemalaGuyanaHaitiHondurasHong KongHungaryIndiaIndonesiaIranIraqIrelandIsraelItalyJamaicaJapanJordanKazakhstanKenyaKoreaKuwaitLaosLatin AmericaLatviaLebanonLiberiaLithuaniaMalaysiaMexicoMicronesiaMiddle AfricaMoldovaMoroccoNepalNetherlandsNicaraguaNigeriaNorth AmericaNorth MacedoniaNorthern AfricaNorthern EuropeNorwayOceaniaPakistanPanamaPeruPhilippinesPolandPortugalRomaniaRussiaSaudi ArabiaScotlandSenegalSerbiaSierra LeoneSingaporeSomaliaSouth AfricaSouth AmericaSouth Central AsiaSouth Eastern AsiaSouthern EuropeSpainSri LankaSt. Vincent and the GrenadinesSudanSwedenSwitzerlandSyriaTaiwanThailandTrinidad and TobagoTurkeyUgandaUkraineUruguayUzbekistanVenezuelaVietnamWest IndiesWestern AfricaWestern AsiaWestern EuropeYemenZaireZimbabweAzores
Child Poverty Among Boys Under 16
Income
Poverty
Unemployment
Labor Participation
Family Structure
Vehicle Availability
Education Level
Disability

Child Poverty Among Boys Under 16 Comparison

Immigrants from Brazil

Sub-Saharan Africans

Exceptional
Tragic
15.4%
CHILD POVERTY AMONG BOYS UNDER 16
90.3/ 100
METRIC RATING
129th/ 347
METRIC RANK
20.0%
CHILD POVERTY AMONG BOYS UNDER 16
0.0/ 100
METRIC RATING
276th/ 347
METRIC RANK

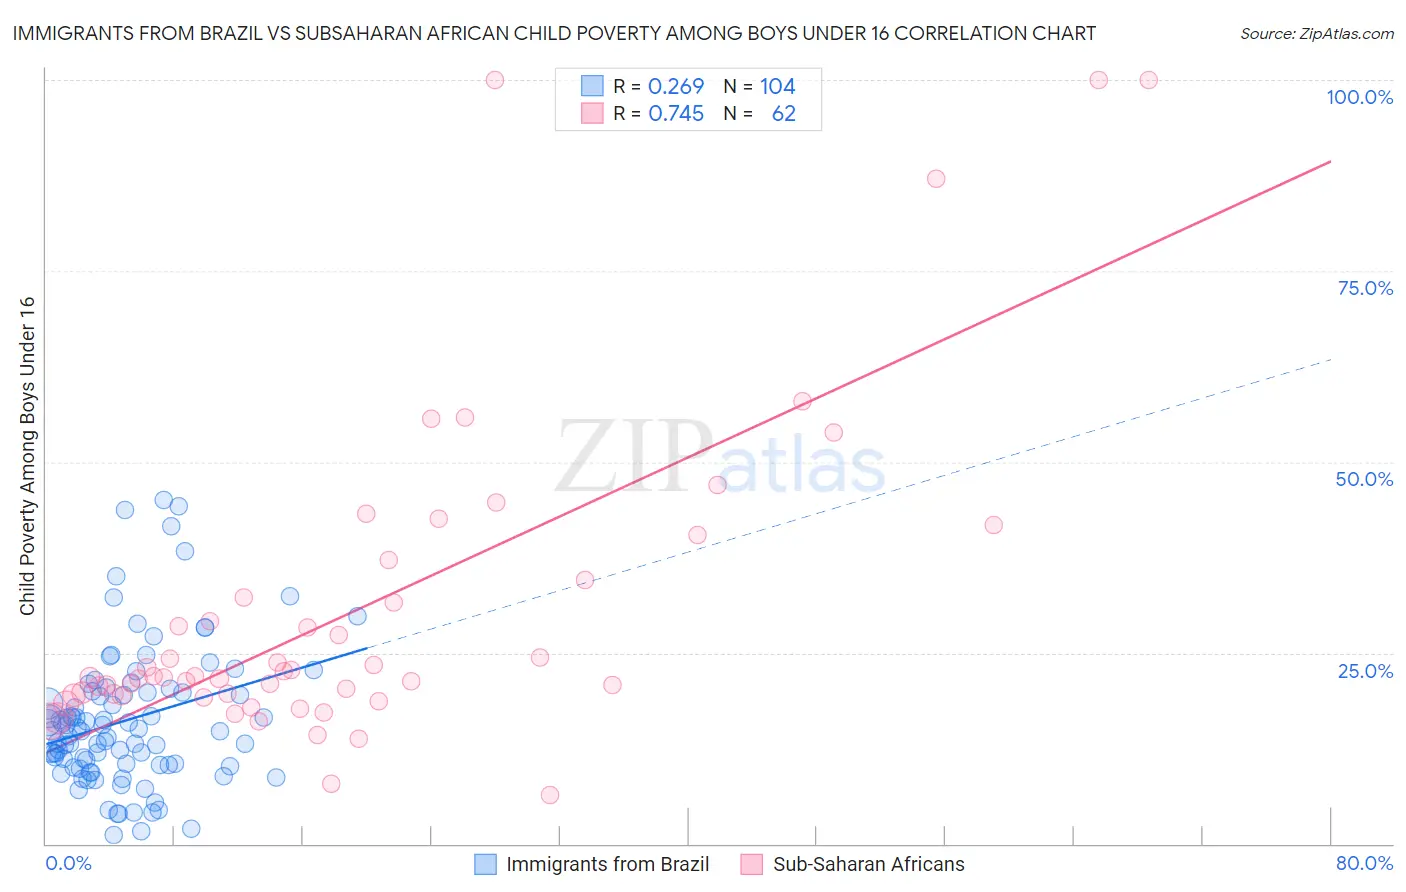
Immigrants from Brazil vs Subsaharan African Child Poverty Among Boys Under 16 Correlation Chart

The statistical analysis conducted on geographies consisting of 337,720,303 people shows a weak positive correlation between the proportion of Immigrants from Brazil and poverty level among boys under the age of 16 in the United States with a correlation coefficient (R) of 0.269 and weighted average of 15.4%. Similarly, the statistical analysis conducted on geographies consisting of 497,613,414 people shows a strong positive correlation between the proportion of Sub-Saharan Africans and poverty level among boys under the age of 16 in the United States with a correlation coefficient (R) of 0.745 and weighted average of 20.0%, a difference of 29.7%.
Immigrants from Brazil vs Subsaharan African Child Poverty Among Boys Under 16

Child Poverty Among Boys Under 16 Correlation Summary

MeasurementImmigrants from BrazilSubsaharan African
Minimum1.1%6.5%
Maximum45.1%100.0%
Range43.9%93.5%
Mean16.2%30.6%
Median14.8%21.9%
Interquartile 25% (IQ1)10.3%19.4%
Interquartile 75% (IQ3)19.9%34.6%
Interquartile Range (IQR)9.6%15.2%
Standard Deviation (Sample)9.2%21.0%
Standard Deviation (Population)9.1%20.8%

Similar Demographics by Child Poverty Among Boys Under 16

Demographics Similar to Immigrants from Brazil by Child Poverty Among Boys Under 16

In terms of child poverty among boys under 16, the demographic groups most similar to Immigrants from Brazil are Mongolian (15.4%, a difference of 0.020%), Immigrants from Western Europe (15.4%, a difference of 0.080%), Canadian (15.4%, a difference of 0.12%), Carpatho Rusyn (15.4%, a difference of 0.31%), and Palestinian (15.4%, a difference of 0.35%).
DemographicsRating | RankChild Poverty Among Boys Under 16
Immigrants | Malaysia
92.8
/100
|
#122
Exceptional
15.3%
Immigrants | Norway
92.3
/100
|
#123
Exceptional
15.3%
Tlingit-Haida
92.2
/100
|
#124
Exceptional
15.3%
Czechoslovakians
92.1
/100
|
#125
Exceptional
15.3%
Palestinians
91.3
/100
|
#126
Exceptional
15.4%
Carpatho Rusyns
91.1
/100
|
#127
Exceptional
15.4%
Canadians
90.6
/100
|
#128
Exceptional
15.4%
Immigrants | Brazil
90.3
/100
|
#129
Exceptional
15.4%
Mongolians
90.2
/100
|
#130
Exceptional
15.4%
Immigrants | Western Europe
90.0
/100
|
#131
Exceptional
15.4%
Immigrants | Kazakhstan
88.7
/100
|
#132
Excellent
15.5%
Welsh
88.3
/100
|
#133
Excellent
15.5%
Peruvians
88.1
/100
|
#134
Excellent
15.5%
Portuguese
87.5
/100
|
#135
Excellent
15.5%
Icelanders
87.5
/100
|
#136
Excellent
15.5%

Demographics Similar to Sub-Saharan Africans by Child Poverty Among Boys Under 16

In terms of child poverty among boys under 16, the demographic groups most similar to Sub-Saharan Africans are Immigrants from Barbados (20.0%, a difference of 0.10%), Immigrants from West Indies (20.0%, a difference of 0.12%), Jamaican (20.0%, a difference of 0.17%), Bangladeshi (20.0%, a difference of 0.25%), and Immigrants from Bangladesh (19.9%, a difference of 0.29%).
DemographicsRating | RankChild Poverty Among Boys Under 16
Immigrants | Cabo Verde
0.1
/100
|
#269
Tragic
19.7%
Cherokee
0.1
/100
|
#270
Tragic
19.7%
Chickasaw
0.1
/100
|
#271
Tragic
19.8%
Immigrants | Ecuador
0.1
/100
|
#272
Tragic
19.8%
Belizeans
0.1
/100
|
#273
Tragic
19.9%
Immigrants | Bangladesh
0.0
/100
|
#274
Tragic
19.9%
Jamaicans
0.0
/100
|
#275
Tragic
20.0%
Sub-Saharan Africans
0.0
/100
|
#276
Tragic
20.0%
Immigrants | Barbados
0.0
/100
|
#277
Tragic
20.0%
Immigrants | West Indies
0.0
/100
|
#278
Tragic
20.0%
Bangladeshis
0.0
/100
|
#279
Tragic
20.0%
Central Americans
0.0
/100
|
#280
Tragic
20.1%
Immigrants | Zaire
0.0
/100
|
#281
Tragic
20.1%
Comanche
0.0
/100
|
#282
Tragic
20.1%
Immigrants | Jamaica
0.0
/100
|
#283
Tragic
20.1%