Immigrants from Bosnia and Herzegovina vs Yuman Seniors Poverty Over the Age of 65
COMPARE
Immigrants from Bosnia and Herzegovina
Yuman
Seniors Poverty Over the Age of 65
Seniors Poverty Over the Age of 65 Comparison
Immigrants from Bosnia and Herzegovina
Yuman
10.4%
SENIORS POVERTY OVER THE AGE OF 65
90.8/ 100
METRIC RATING
120th/ 347
METRIC RANK
13.1%
SENIORS POVERTY OVER THE AGE OF 65
0.0/ 100
METRIC RATING
280th/ 347
METRIC RANK
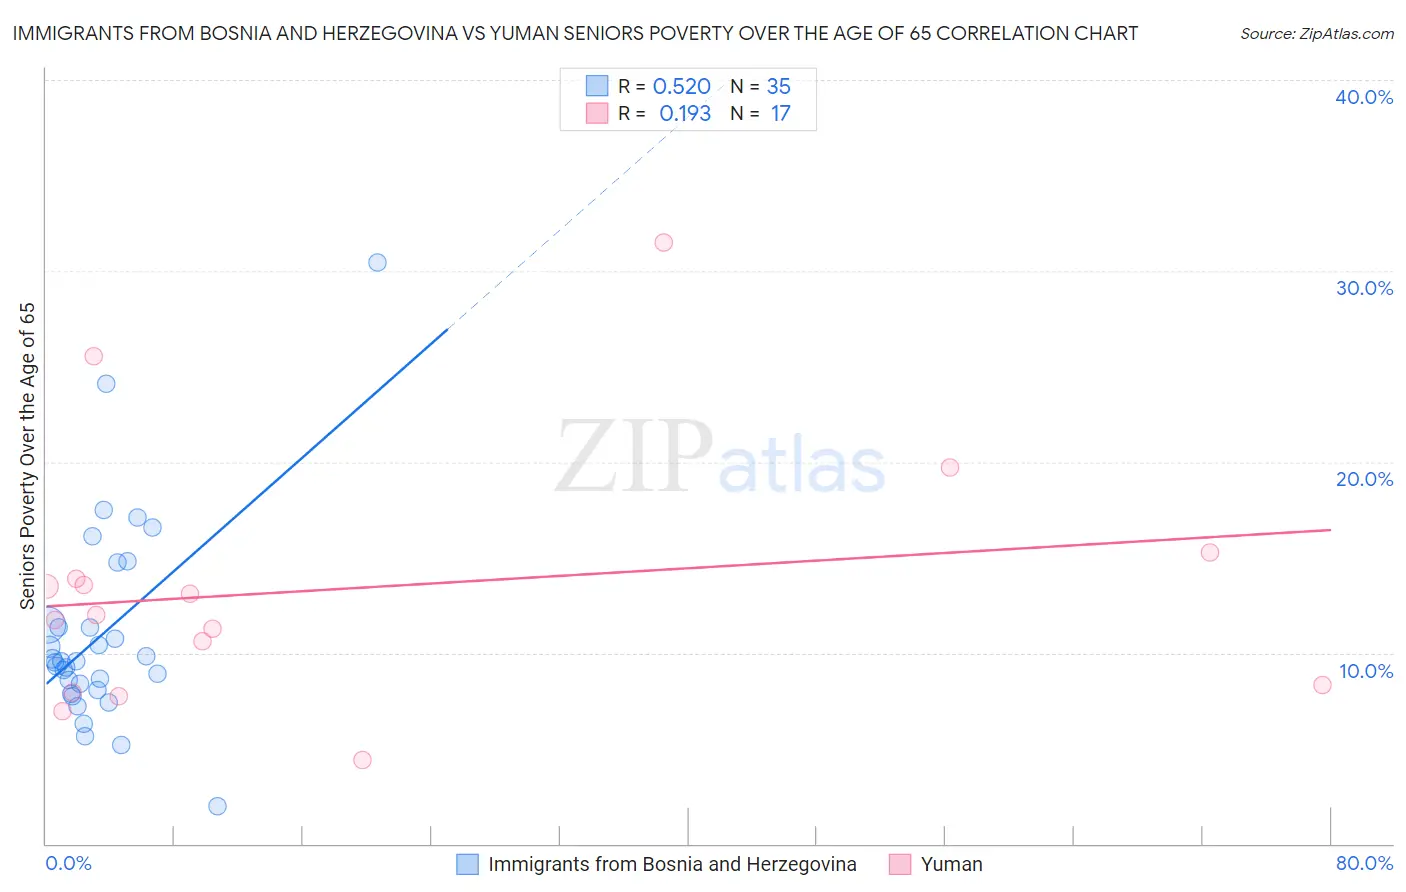
Immigrants from Bosnia and Herzegovina vs Yuman Seniors Poverty Over the Age of 65 Correlation Chart
The statistical analysis conducted on geographies consisting of 156,713,515 people shows a substantial positive correlation between the proportion of Immigrants from Bosnia and Herzegovina and poverty level among seniors over the age of 65 in the United States with a correlation coefficient (R) of 0.520 and weighted average of 10.4%. Similarly, the statistical analysis conducted on geographies consisting of 40,596,449 people shows a poor positive correlation between the proportion of Yuman and poverty level among seniors over the age of 65 in the United States with a correlation coefficient (R) of 0.193 and weighted average of 13.1%, a difference of 26.0%.
Seniors Poverty Over the Age of 65 Correlation Summary
| Measurement | Immigrants from Bosnia and Herzegovina | Yuman |
| Minimum | 1.9% | 4.4% |
| Maximum | 30.4% | 31.5% |
| Range | 28.5% | 27.1% |
| Mean | 11.0% | 13.4% |
| Median | 9.5% | 12.0% |
| Interquartile 25% (IQ1) | 8.0% | 8.1% |
| Interquartile 75% (IQ3) | 11.5% | 14.6% |
| Interquartile Range (IQR) | 3.4% | 6.4% |
| Standard Deviation (Sample) | 5.4% | 6.8% |
| Standard Deviation (Population) | 5.3% | 6.6% |
Similar Demographics by Seniors Poverty Over the Age of 65
Demographics Similar to Immigrants from Bosnia and Herzegovina by Seniors Poverty Over the Age of 65
In terms of seniors poverty over the age of 65, the demographic groups most similar to Immigrants from Bosnia and Herzegovina are Immigrants from Iraq (10.4%, a difference of 0.040%), Immigrants from Moldova (10.4%, a difference of 0.040%), Immigrants from Western Europe (10.4%, a difference of 0.060%), Hmong (10.4%, a difference of 0.22%), and Asian (10.4%, a difference of 0.25%).
| Demographics | Rating | Rank | Seniors Poverty Over the Age of 65 |
| Immigrants | Romania | 93.3 /100 | #113 | Exceptional 10.3% |
| Immigrants | Denmark | 92.7 /100 | #114 | Exceptional 10.3% |
| Immigrants | Italy | 92.6 /100 | #115 | Exceptional 10.3% |
| Pakistanis | 92.2 /100 | #116 | Exceptional 10.3% |
| Lebanese | 92.0 /100 | #117 | Exceptional 10.3% |
| Okinawans | 91.7 /100 | #118 | Exceptional 10.4% |
| Immigrants | Western Europe | 91.1 /100 | #119 | Exceptional 10.4% |
| Immigrants | Bosnia and Herzegovina | 90.8 /100 | #120 | Exceptional 10.4% |
| Immigrants | Iraq | 90.7 /100 | #121 | Exceptional 10.4% |
| Immigrants | Moldova | 90.7 /100 | #122 | Exceptional 10.4% |
| Hmong | 90.0 /100 | #123 | Exceptional 10.4% |
| Asians | 89.9 /100 | #124 | Excellent 10.4% |
| Immigrants | Philippines | 89.4 /100 | #125 | Excellent 10.4% |
| Immigrants | Hungary | 89.1 /100 | #126 | Excellent 10.4% |
| Cambodians | 89.1 /100 | #127 | Excellent 10.4% |
Demographics Similar to Yuman by Seniors Poverty Over the Age of 65
In terms of seniors poverty over the age of 65, the demographic groups most similar to Yuman are Mexican (13.1%, a difference of 0.040%), Immigrants from Bahamas (13.0%, a difference of 0.20%), Immigrants from El Salvador (13.1%, a difference of 0.44%), Paiute (12.9%, a difference of 1.0%), and Immigrants from the Azores (12.9%, a difference of 1.1%).
| Demographics | Rating | Rank | Seniors Poverty Over the Age of 65 |
| Kiowa | 0.0 /100 | #273 | Tragic 12.8% |
| Salvadorans | 0.0 /100 | #274 | Tragic 12.8% |
| Immigrants | Colombia | 0.0 /100 | #275 | Tragic 12.9% |
| Immigrants | Azores | 0.0 /100 | #276 | Tragic 12.9% |
| Paiute | 0.0 /100 | #277 | Tragic 12.9% |
| Immigrants | Bahamas | 0.0 /100 | #278 | Tragic 13.0% |
| Mexicans | 0.0 /100 | #279 | Tragic 13.1% |
| Yuman | 0.0 /100 | #280 | Tragic 13.1% |
| Immigrants | El Salvador | 0.0 /100 | #281 | Tragic 13.1% |
| Senegalese | 0.0 /100 | #282 | Tragic 13.3% |
| Central Americans | 0.0 /100 | #283 | Tragic 13.4% |
| Colville | 0.0 /100 | #284 | Tragic 13.5% |
| Guatemalans | 0.0 /100 | #285 | Tragic 13.5% |
| Immigrants | Senegal | 0.0 /100 | #286 | Tragic 13.6% |
| Immigrants | Mexico | 0.0 /100 | #287 | Tragic 13.6% |