Immigrants from Bosnia and Herzegovina vs Kenyan Poverty

COMPARE

Immigrants from Bosnia and Herzegovina
Race
Ancestry
AfghanAfricanAlaska NativeAlaskan AthabascanAlbanianAleutAlsatianAmericanApacheArabArapahoArgentineanArmenianAssyrian/Chaldean/SyriacAustralianAustrianBahamianBangladeshiBarbadianBasqueBelgianBelizeanBermudanBhutaneseBlackfeetBolivianBrazilianBritishBritish West IndianBulgarianBurmeseCajunCambodianCanadianCape VerdeanCarpatho RusynCelticCentral AmericanCentral American IndianCherokeeCheyenneChickasawChileanChineseChippewaChoctawColombianColvilleComancheCosta RicanCreeCreekCroatianCrowCubanCypriotCzechCzechoslovakianDanishDelawareDominicanDutchDutch West IndianEastern EuropeanEcuadorianEgyptianEnglishEstonianEthiopianEuropeanFijianFilipinoFinnishFrenchFrench American IndianFrench CanadianGermanGerman RussianGhanaianGreekGuamanian/ChamorroGuatemalanGuyaneseHaitianHmongHonduranHopiHoumaHungarianIcelanderIndian (Asian)IndonesianInupiatIranianIraqiIrishIroquoisIsraeliItalianJamaicanJapaneseJordanianKiowaKoreanLaotianLatvianLebaneseLiberianLithuanianLumbeeLuxembourgerMacedonianMalaysianMalteseMarshalleseMenomineeMexicanMexican American IndianMongolianMoroccanNative HawaiianNavajoNepaleseNew ZealanderNicaraguanNigerianNorthern EuropeanNorwegianOkinawanOsageOttawaPaiutePakistaniPalestinianPanamanianParaguayanPennsylvania GermanPeruvianPimaPolishPortuguesePotawatomiPuebloPuerto RicanPuget Sound SalishRomanianRussianSalvadoranSamoanScandinavianScotch-IrishScottishSeminoleSenegaleseSerbianShoshoneSierra LeoneanSiouxSlavicSlovakSloveneSomaliSouth AfricanSouth AmericanSouth American IndianSoviet UnionSpaniardSpanishSpanish AmericanSpanish American IndianSri LankanSubsaharan AfricanSudaneseSwedishSwissSyrianTaiwaneseThaiTlingit-HaidaTohono O'OdhamTonganTrinidadian and TobagonianTsimshianTurkishU.S. Virgin IslanderUgandanUkrainianUruguayanUteVenezuelanVietnameseWelshWest IndianYakamaYaquiYugoslavianYumanYup'ikZimbabwean
Immigration
NonimmigrantsImmigrantsAfghanistanAfricaAlbaniaArgentinaArmeniaAsiaAustraliaAustriaBahamasBangladeshBarbadosBelarusBelgiumBelizeBoliviaBosnia and HerzegovinaBrazilBulgariaBurma/MyanmarCabo VerdeCambodiaCameroonCanadaCaribbeanCentral AmericaChileChinaColombiaCongoCosta RicaCroatiaCubaCzechoslovakiaDenmarkDominicaDominican RepublicEastern AfricaEastern AsiaEastern EuropeEcuadorEgyptEl SalvadorEnglandEritreaEthiopiaEuropeFijiFranceGermanyGhanaGreeceGrenadaGuatemalaGuyanaHaitiHondurasHong KongHungaryIndiaIndonesiaIranIraqIrelandIsraelItalyJamaicaJapanJordanKazakhstanKenyaKoreaKuwaitLaosLatin AmericaLatviaLebanonLiberiaLithuaniaMalaysiaMexicoMicronesiaMiddle AfricaMoldovaMoroccoNepalNetherlandsNicaraguaNigeriaNorth AmericaNorth MacedoniaNorthern AfricaNorthern EuropeNorwayOceaniaPakistanPanamaPeruPhilippinesPolandPortugalRomaniaRussiaSaudi ArabiaScotlandSenegalSerbiaSierra LeoneSingaporeSomaliaSouth AfricaSouth AmericaSouth Central AsiaSouth Eastern AsiaSouthern EuropeSpainSri LankaSt. Vincent and the GrenadinesSudanSwedenSwitzerlandSyriaTaiwanThailandTrinidad and TobagoTurkeyUgandaUkraineUruguayUzbekistanVenezuelaVietnamWest IndiesWestern AfricaWestern AsiaWestern EuropeYemenZaireZimbabweAzores
Kenyan
Race
Ancestry
AfghanAfricanAlaska NativeAlaskan AthabascanAlbanianAleutAlsatianAmericanApacheArabArapahoArgentineanArmenianAssyrian/Chaldean/SyriacAustralianAustrianBahamianBangladeshiBarbadianBasqueBelgianBelizeanBermudanBhutaneseBlackfeetBolivianBrazilianBritishBritish West IndianBulgarianBurmeseCajunCambodianCanadianCape VerdeanCarpatho RusynCelticCentral AmericanCentral American IndianCherokeeCheyenneChickasawChileanChineseChippewaChoctawColombianColvilleComancheCosta RicanCreeCreekCroatianCrowCubanCypriotCzechCzechoslovakianDanishDelawareDominicanDutchDutch West IndianEastern EuropeanEcuadorianEgyptianEnglishEstonianEthiopianEuropeanFijianFilipinoFinnishFrenchFrench American IndianFrench CanadianGermanGerman RussianGhanaianGreekGuamanian/ChamorroGuatemalanGuyaneseHaitianHmongHonduranHopiHoumaHungarianIcelanderIndian (Asian)IndonesianInupiatIranianIraqiIrishIroquoisIsraeliItalianJamaicanJapaneseJordanianKenyanKiowaKoreanLaotianLatvianLebaneseLiberianLithuanianLumbeeLuxembourgerMacedonianMalaysianMalteseMarshalleseMenomineeMexicanMexican American IndianMongolianMoroccanNative HawaiianNavajoNepaleseNew ZealanderNicaraguanNigerianNorthern EuropeanNorwegianOkinawanOsageOttawaPaiutePakistaniPalestinianPanamanianParaguayanPennsylvania GermanPeruvianPimaPolishPortuguesePotawatomiPuebloPuerto RicanPuget Sound SalishRomanianRussianSalvadoranSamoanScandinavianScotch-IrishScottishSeminoleSenegaleseSerbianShoshoneSierra LeoneanSiouxSlavicSlovakSloveneSomaliSouth AfricanSouth AmericanSouth American IndianSoviet UnionSpaniardSpanishSpanish AmericanSpanish American IndianSri LankanSubsaharan AfricanSudaneseSwedishSwissSyrianTaiwaneseThaiTlingit-HaidaTohono O'OdhamTonganTrinidadian and TobagonianTsimshianTurkishU.S. Virgin IslanderUgandanUkrainianUruguayanUteVenezuelanVietnameseWelshWest IndianYakamaYaquiYugoslavianYumanYup'ikZimbabwean
Immigration
NonimmigrantsImmigrantsAfghanistanAfricaAlbaniaArgentinaArmeniaAsiaAustraliaAustriaBahamasBangladeshBarbadosBelarusBelgiumBelizeBoliviaBrazilBulgariaBurma/MyanmarCabo VerdeCambodiaCameroonCanadaCaribbeanCentral AmericaChileChinaColombiaCongoCosta RicaCroatiaCubaCzechoslovakiaDenmarkDominicaDominican RepublicEastern AfricaEastern AsiaEastern EuropeEcuadorEgyptEl SalvadorEnglandEritreaEthiopiaEuropeFijiFranceGermanyGhanaGreeceGrenadaGuatemalaGuyanaHaitiHondurasHong KongHungaryIndiaIndonesiaIranIraqIrelandIsraelItalyJamaicaJapanJordanKazakhstanKenyaKoreaKuwaitLaosLatin AmericaLatviaLebanonLiberiaLithuaniaMalaysiaMexicoMicronesiaMiddle AfricaMoldovaMoroccoNepalNetherlandsNicaraguaNigeriaNorth AmericaNorth MacedoniaNorthern AfricaNorthern EuropeNorwayOceaniaPakistanPanamaPeruPhilippinesPolandPortugalRomaniaRussiaSaudi ArabiaScotlandSenegalSerbiaSierra LeoneSingaporeSomaliaSouth AfricaSouth AmericaSouth Central AsiaSouth Eastern AsiaSouthern EuropeSpainSri LankaSt. Vincent and the GrenadinesSudanSwedenSwitzerlandSyriaTaiwanThailandTrinidad and TobagoTurkeyUgandaUkraineUruguayUzbekistanVenezuelaVietnamWest IndiesWestern AfricaWestern AsiaWestern EuropeYemenZaireZimbabweAzores
Poverty
Income
Poverty
Unemployment
Labor Participation
Family Structure
Vehicle Availability
Education Level
Disability

Poverty Comparison

Immigrants from Bosnia and Herzegovina

Kenyans

Good
Fair
12.0%
POVERTY
73.7/ 100
METRIC RATING
147th/ 347
METRIC RANK
12.5%
POVERTY
38.8/ 100
METRIC RATING
184th/ 347
METRIC RANK

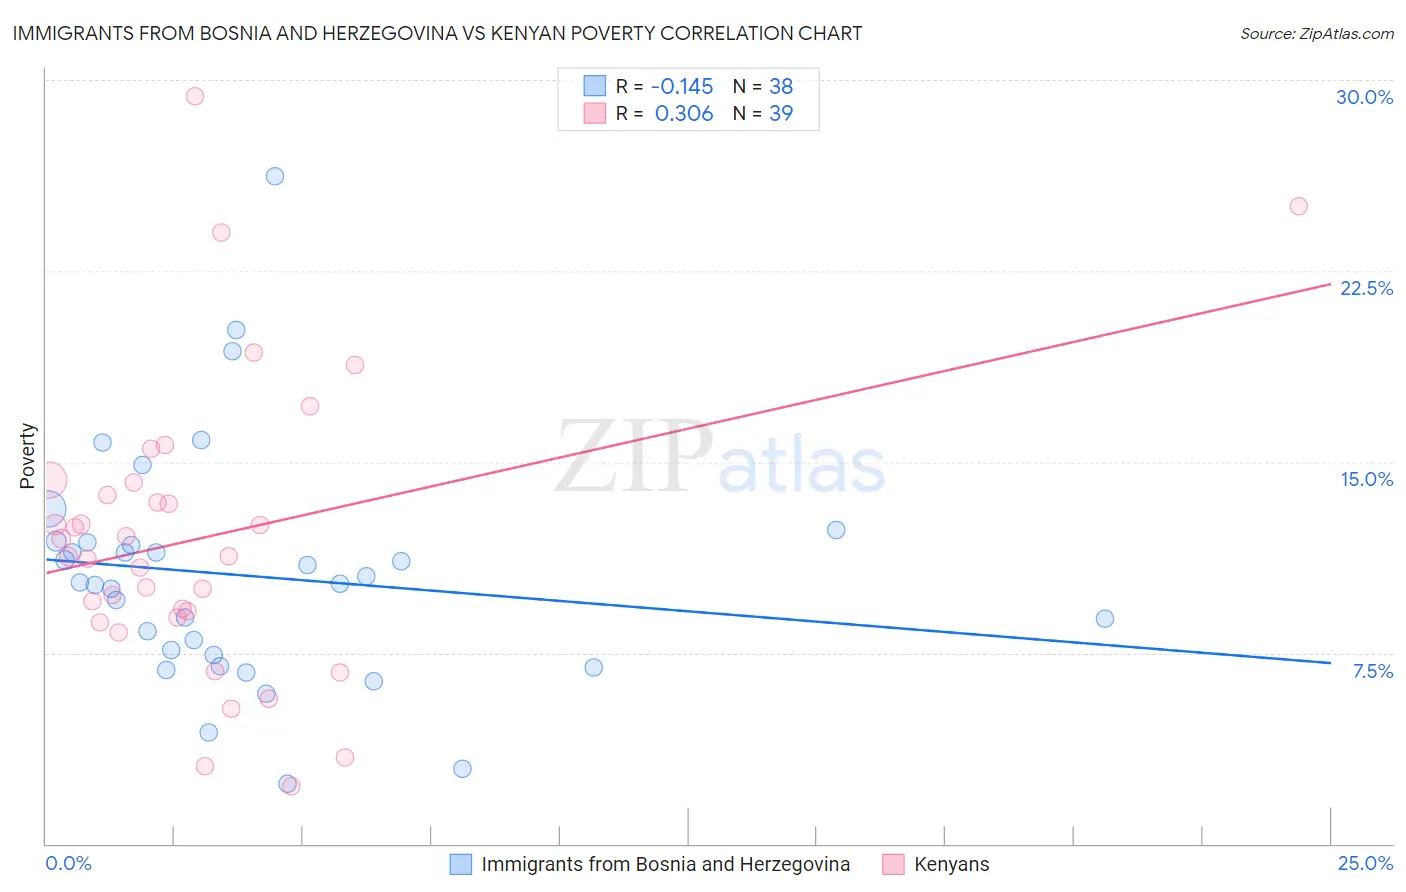
Immigrants from Bosnia and Herzegovina vs Kenyan Poverty Correlation Chart

The statistical analysis conducted on geographies consisting of 156,765,120 people shows a poor negative correlation between the proportion of Immigrants from Bosnia and Herzegovina and poverty level in the United States with a correlation coefficient (R) of -0.145 and weighted average of 12.0%. Similarly, the statistical analysis conducted on geographies consisting of 168,174,579 people shows a mild positive correlation between the proportion of Kenyans and poverty level in the United States with a correlation coefficient (R) of 0.306 and weighted average of 12.5%, a difference of 3.7%.
Immigrants from Bosnia and Herzegovina vs Kenyan Poverty

Poverty Correlation Summary

MeasurementImmigrants from Bosnia and HerzegovinaKenyan
Minimum2.3%2.2%
Maximum26.2%29.3%
Range23.9%27.1%
Mean10.5%12.0%
Median10.2%11.3%
Interquartile 25% (IQ1)7.4%8.9%
Interquartile 75% (IQ3)11.8%14.2%
Interquartile Range (IQR)4.4%5.3%
Standard Deviation (Sample)4.7%5.7%
Standard Deviation (Population)4.6%5.7%

Similar Demographics by Poverty

Demographics Similar to Immigrants from Bosnia and Herzegovina by Poverty

In terms of poverty, the demographic groups most similar to Immigrants from Bosnia and Herzegovina are Immigrants from Germany (12.0%, a difference of 0.12%), Immigrants from Malaysia (12.0%, a difference of 0.12%), Afghan (12.0%, a difference of 0.16%), Immigrants from Kazakhstan (12.0%, a difference of 0.17%), and Syrian (12.0%, a difference of 0.19%).
DemographicsRating | RankPoverty
Immigrants | Peru
81.1
/100
|
#140
Excellent
11.9%
Immigrants | France
80.5
/100
|
#141
Excellent
11.9%
Basques
80.4
/100
|
#142
Excellent
11.9%
Brazilians
79.7
/100
|
#143
Good
11.9%
Icelanders
77.9
/100
|
#144
Good
11.9%
Syrians
75.1
/100
|
#145
Good
12.0%
Afghans
74.9
/100
|
#146
Good
12.0%
Immigrants | Bosnia and Herzegovina
73.7
/100
|
#147
Good
12.0%
Immigrants | Germany
72.7
/100
|
#148
Good
12.0%
Immigrants | Malaysia
72.7
/100
|
#149
Good
12.0%
Immigrants | Kazakhstan
72.3
/100
|
#150
Good
12.0%
Samoans
71.9
/100
|
#151
Good
12.0%
Armenians
67.6
/100
|
#152
Good
12.1%
Immigrants | Northern Africa
63.9
/100
|
#153
Good
12.1%
Guamanians/Chamorros
63.9
/100
|
#154
Good
12.1%

Demographics Similar to Kenyans by Poverty

In terms of poverty, the demographic groups most similar to Kenyans are Immigrants from Iraq (12.4%, a difference of 0.13%), Israeli (12.5%, a difference of 0.24%), Immigrants from Sierra Leone (12.5%, a difference of 0.26%), Immigrants from Cameroon (12.4%, a difference of 0.29%), and Immigrants from Afghanistan (12.4%, a difference of 0.33%).
DemographicsRating | RankPoverty
Immigrants | Syria
47.5
/100
|
#177
Average
12.3%
Uruguayans
44.7
/100
|
#178
Average
12.4%
Immigrants | Morocco
44.0
/100
|
#179
Average
12.4%
Mongolians
43.6
/100
|
#180
Average
12.4%
Immigrants | Afghanistan
42.1
/100
|
#181
Average
12.4%
Immigrants | Cameroon
41.7
/100
|
#182
Average
12.4%
Immigrants | Iraq
40.2
/100
|
#183
Average
12.4%
Kenyans
38.8
/100
|
#184
Fair
12.5%
Israelis
36.4
/100
|
#185
Fair
12.5%
Immigrants | Sierra Leone
36.3
/100
|
#186
Fair
12.5%
Hawaiians
34.1
/100
|
#187
Fair
12.5%
Immigrants | Costa Rica
33.3
/100
|
#188
Fair
12.5%
Aleuts
33.2
/100
|
#189
Fair
12.5%
Immigrants | South America
32.3
/100
|
#190
Fair
12.5%
Sierra Leoneans
31.5
/100
|
#191
Fair
12.6%