Immigrants from Belize vs Cambodian Child Poverty Among Boys Under 16
COMPARE
Immigrants from Belize
Cambodian
Child Poverty Among Boys Under 16
Child Poverty Among Boys Under 16 Comparison
Immigrants from Belize
Cambodians
20.3%
CHILD POVERTY AMONG BOYS UNDER 16
0.0/ 100
METRIC RATING
287th/ 347
METRIC RANK
14.5%
CHILD POVERTY AMONG BOYS UNDER 16
98.5/ 100
METRIC RATING
63rd/ 347
METRIC RANK
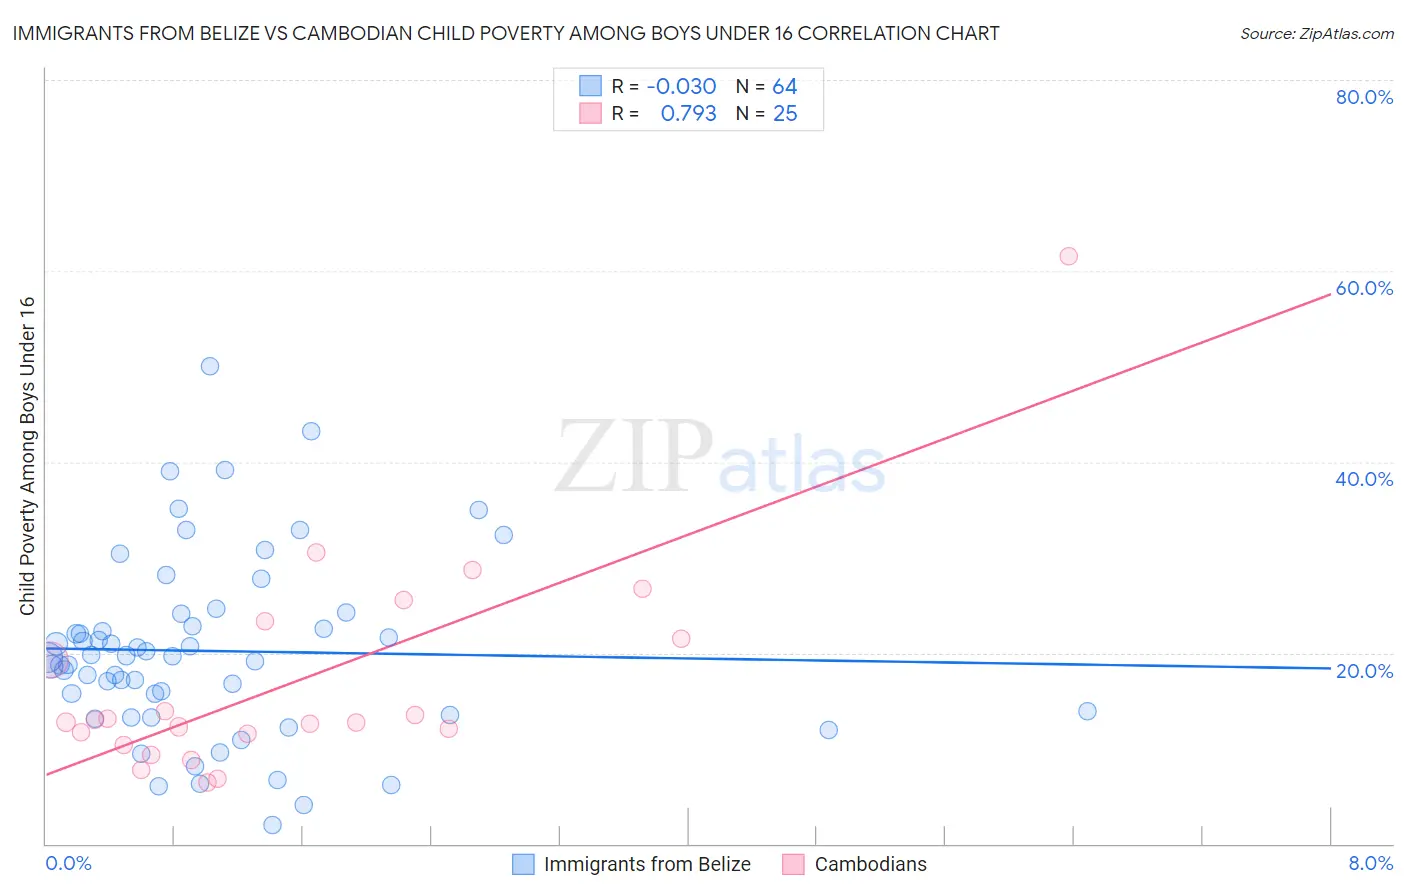
Immigrants from Belize vs Cambodian Child Poverty Among Boys Under 16 Correlation Chart
The statistical analysis conducted on geographies consisting of 129,792,117 people shows no correlation between the proportion of Immigrants from Belize and poverty level among boys under the age of 16 in the United States with a correlation coefficient (R) of -0.030 and weighted average of 20.3%. Similarly, the statistical analysis conducted on geographies consisting of 102,113,836 people shows a strong positive correlation between the proportion of Cambodians and poverty level among boys under the age of 16 in the United States with a correlation coefficient (R) of 0.793 and weighted average of 14.5%, a difference of 39.7%.
Child Poverty Among Boys Under 16 Correlation Summary
| Measurement | Immigrants from Belize | Cambodian |
| Minimum | 2.0% | 6.4% |
| Maximum | 50.0% | 61.5% |
| Range | 48.0% | 55.1% |
| Mean | 20.2% | 17.0% |
| Median | 19.6% | 12.7% |
| Interquartile 25% (IQ1) | 13.7% | 10.9% |
| Interquartile 75% (IQ3) | 23.4% | 22.4% |
| Interquartile Range (IQR) | 9.7% | 11.4% |
| Standard Deviation (Sample) | 9.6% | 11.6% |
| Standard Deviation (Population) | 9.5% | 11.4% |
Similar Demographics by Child Poverty Among Boys Under 16
Demographics Similar to Immigrants from Belize by Child Poverty Among Boys Under 16
In terms of child poverty among boys under 16, the demographic groups most similar to Immigrants from Belize are West Indian (20.3%, a difference of 0.060%), Immigrants from St. Vincent and the Grenadines (20.3%, a difference of 0.27%), Arapaho (20.2%, a difference of 0.40%), Blackfeet (20.4%, a difference of 0.52%), and Barbadian (20.2%, a difference of 0.55%).
| Demographics | Rating | Rank | Child Poverty Among Boys Under 16 |
| Central Americans | 0.0 /100 | #280 | Tragic 20.1% |
| Immigrants | Zaire | 0.0 /100 | #281 | Tragic 20.1% |
| Comanche | 0.0 /100 | #282 | Tragic 20.1% |
| Immigrants | Jamaica | 0.0 /100 | #283 | Tragic 20.1% |
| Barbadians | 0.0 /100 | #284 | Tragic 20.2% |
| Arapaho | 0.0 /100 | #285 | Tragic 20.2% |
| West Indians | 0.0 /100 | #286 | Tragic 20.3% |
| Immigrants | Belize | 0.0 /100 | #287 | Tragic 20.3% |
| Immigrants | St. Vincent and the Grenadines | 0.0 /100 | #288 | Tragic 20.3% |
| Blackfeet | 0.0 /100 | #289 | Tragic 20.4% |
| Senegalese | 0.0 /100 | #290 | Tragic 20.6% |
| Immigrants | Latin America | 0.0 /100 | #291 | Tragic 20.6% |
| Yaqui | 0.0 /100 | #292 | Tragic 20.7% |
| Immigrants | Senegal | 0.0 /100 | #293 | Tragic 20.7% |
| Immigrants | Bahamas | 0.0 /100 | #294 | Tragic 20.7% |
Demographics Similar to Cambodians by Child Poverty Among Boys Under 16
In terms of child poverty among boys under 16, the demographic groups most similar to Cambodians are Immigrants from Romania (14.5%, a difference of 0.13%), Soviet Union (14.5%, a difference of 0.16%), Immigrants from Bulgaria (14.5%, a difference of 0.17%), Immigrants from Europe (14.5%, a difference of 0.19%), and Slovene (14.5%, a difference of 0.28%).
| Demographics | Rating | Rank | Child Poverty Among Boys Under 16 |
| Zimbabweans | 99.0 /100 | #56 | Exceptional 14.3% |
| Poles | 98.9 /100 | #57 | Exceptional 14.4% |
| Immigrants | Sweden | 98.9 /100 | #58 | Exceptional 14.4% |
| Immigrants | Czechoslovakia | 98.9 /100 | #59 | Exceptional 14.4% |
| Immigrants | Belgium | 98.9 /100 | #60 | Exceptional 14.4% |
| Scandinavians | 98.8 /100 | #61 | Exceptional 14.4% |
| Immigrants | Israel | 98.7 /100 | #62 | Exceptional 14.4% |
| Cambodians | 98.5 /100 | #63 | Exceptional 14.5% |
| Immigrants | Romania | 98.5 /100 | #64 | Exceptional 14.5% |
| Soviet Union | 98.5 /100 | #65 | Exceptional 14.5% |
| Immigrants | Bulgaria | 98.5 /100 | #66 | Exceptional 14.5% |
| Immigrants | Europe | 98.4 /100 | #67 | Exceptional 14.5% |
| Slovenes | 98.4 /100 | #68 | Exceptional 14.5% |
| Immigrants | Austria | 98.4 /100 | #69 | Exceptional 14.5% |
| Europeans | 98.4 /100 | #70 | Exceptional 14.5% |