Immigrants from Belarus vs Immigrants from Japan Child Poverty Among Girls Under 16

COMPARE

Immigrants from Belarus
Race
Ancestry
AfghanAfricanAlaska NativeAlaskan AthabascanAlbanianAleutAlsatianAmericanApacheArabArapahoArgentineanArmenianAssyrian/Chaldean/SyriacAustralianAustrianBahamianBangladeshiBarbadianBasqueBelgianBelizeanBermudanBhutaneseBlackfeetBolivianBrazilianBritishBritish West IndianBulgarianBurmeseCajunCambodianCanadianCape VerdeanCarpatho RusynCelticCentral AmericanCentral American IndianCherokeeCheyenneChickasawChileanChineseChippewaChoctawColombianColvilleComancheCosta RicanCreeCreekCroatianCrowCubanCypriotCzechCzechoslovakianDanishDelawareDominicanDutchDutch West IndianEastern EuropeanEcuadorianEgyptianEnglishEstonianEthiopianEuropeanFijianFilipinoFinnishFrenchFrench American IndianFrench CanadianGermanGerman RussianGhanaianGreekGuamanian/ChamorroGuatemalanGuyaneseHaitianHmongHonduranHopiHoumaHungarianIcelanderIndian (Asian)IndonesianInupiatIranianIraqiIrishIroquoisIsraeliItalianJamaicanJapaneseJordanianKenyanKiowaKoreanLaotianLatvianLebaneseLiberianLithuanianLumbeeLuxembourgerMacedonianMalaysianMalteseMarshalleseMenomineeMexicanMexican American IndianMongolianMoroccanNative HawaiianNavajoNepaleseNew ZealanderNicaraguanNigerianNorthern EuropeanNorwegianOkinawanOsageOttawaPaiutePakistaniPalestinianPanamanianParaguayanPennsylvania GermanPeruvianPimaPolishPortuguesePotawatomiPuebloPuerto RicanPuget Sound SalishRomanianRussianSalvadoranSamoanScandinavianScotch-IrishScottishSeminoleSenegaleseSerbianShoshoneSierra LeoneanSiouxSlavicSlovakSloveneSomaliSouth AfricanSouth AmericanSouth American IndianSoviet UnionSpaniardSpanishSpanish AmericanSpanish American IndianSri LankanSubsaharan AfricanSudaneseSwedishSwissSyrianTaiwaneseThaiTlingit-HaidaTohono O'OdhamTonganTrinidadian and TobagonianTsimshianTurkishU.S. Virgin IslanderUgandanUkrainianUruguayanUteVenezuelanVietnameseWelshWest IndianYakamaYaquiYugoslavianYumanYup'ikZimbabwean
Immigration
NonimmigrantsImmigrantsAfghanistanAfricaAlbaniaArgentinaArmeniaAsiaAustraliaAustriaBahamasBangladeshBarbadosBelarusBelgiumBelizeBoliviaBosnia and HerzegovinaBrazilBulgariaBurma/MyanmarCabo VerdeCambodiaCameroonCanadaCaribbeanCentral AmericaChileChinaColombiaCongoCosta RicaCroatiaCubaCzechoslovakiaDenmarkDominicaDominican RepublicEastern AfricaEastern AsiaEastern EuropeEcuadorEgyptEl SalvadorEnglandEritreaEthiopiaEuropeFijiFranceGermanyGhanaGreeceGrenadaGuatemalaGuyanaHaitiHondurasHong KongHungaryIndiaIndonesiaIranIraqIrelandIsraelItalyJamaicaJordanKazakhstanKenyaKoreaKuwaitLaosLatin AmericaLatviaLebanonLiberiaLithuaniaMalaysiaMexicoMicronesiaMiddle AfricaMoldovaMoroccoNepalNetherlandsNicaraguaNigeriaNorth AmericaNorth MacedoniaNorthern AfricaNorthern EuropeNorwayOceaniaPakistanPanamaPeruPhilippinesPolandPortugalRomaniaRussiaSaudi ArabiaScotlandSenegalSerbiaSierra LeoneSingaporeSomaliaSouth AfricaSouth AmericaSouth Central AsiaSouth Eastern AsiaSouthern EuropeSpainSri LankaSt. Vincent and the GrenadinesSudanSwedenSwitzerlandSyriaTaiwanThailandTrinidad and TobagoTurkeyUgandaUkraineUruguayUzbekistanVenezuelaVietnamWest IndiesWestern AfricaWestern AsiaWestern EuropeYemenZaireZimbabweAzores
Immigrants from Japan
Race
Ancestry
AfghanAfricanAlaska NativeAlaskan AthabascanAlbanianAleutAlsatianAmericanApacheArabArapahoArgentineanArmenianAssyrian/Chaldean/SyriacAustralianAustrianBahamianBangladeshiBarbadianBasqueBelgianBelizeanBermudanBhutaneseBlackfeetBolivianBrazilianBritishBritish West IndianBulgarianBurmeseCajunCambodianCanadianCape VerdeanCarpatho RusynCelticCentral AmericanCentral American IndianCherokeeCheyenneChickasawChileanChineseChippewaChoctawColombianColvilleComancheCosta RicanCreeCreekCroatianCrowCubanCypriotCzechCzechoslovakianDanishDelawareDominicanDutchDutch West IndianEastern EuropeanEcuadorianEgyptianEnglishEstonianEthiopianEuropeanFijianFilipinoFinnishFrenchFrench American IndianFrench CanadianGermanGerman RussianGhanaianGreekGuamanian/ChamorroGuatemalanGuyaneseHaitianHmongHonduranHopiHoumaHungarianIcelanderIndian (Asian)IndonesianInupiatIranianIraqiIrishIroquoisIsraeliItalianJamaicanJapaneseJordanianKenyanKiowaKoreanLaotianLatvianLebaneseLiberianLithuanianLumbeeLuxembourgerMacedonianMalaysianMalteseMarshalleseMenomineeMexicanMexican American IndianMongolianMoroccanNative HawaiianNavajoNepaleseNew ZealanderNicaraguanNigerianNorthern EuropeanNorwegianOkinawanOsageOttawaPaiutePakistaniPalestinianPanamanianParaguayanPennsylvania GermanPeruvianPimaPolishPortuguesePotawatomiPuebloPuerto RicanPuget Sound SalishRomanianRussianSalvadoranSamoanScandinavianScotch-IrishScottishSeminoleSenegaleseSerbianShoshoneSierra LeoneanSiouxSlavicSlovakSloveneSomaliSouth AfricanSouth AmericanSouth American IndianSoviet UnionSpaniardSpanishSpanish AmericanSpanish American IndianSri LankanSubsaharan AfricanSudaneseSwedishSwissSyrianTaiwaneseThaiTlingit-HaidaTohono O'OdhamTonganTrinidadian and TobagonianTsimshianTurkishU.S. Virgin IslanderUgandanUkrainianUruguayanUteVenezuelanVietnameseWelshWest IndianYakamaYaquiYugoslavianYumanYup'ikZimbabwean
Immigration
NonimmigrantsImmigrantsAfghanistanAfricaAlbaniaArgentinaArmeniaAsiaAustraliaAustriaBahamasBangladeshBarbadosBelgiumBelizeBoliviaBosnia and HerzegovinaBrazilBulgariaBurma/MyanmarCabo VerdeCambodiaCameroonCanadaCaribbeanCentral AmericaChileChinaColombiaCongoCosta RicaCroatiaCubaCzechoslovakiaDenmarkDominicaDominican RepublicEastern AfricaEastern AsiaEastern EuropeEcuadorEgyptEl SalvadorEnglandEritreaEthiopiaEuropeFijiFranceGermanyGhanaGreeceGrenadaGuatemalaGuyanaHaitiHondurasHong KongHungaryIndiaIndonesiaIranIraqIrelandIsraelItalyJamaicaJapanJordanKazakhstanKenyaKoreaKuwaitLaosLatin AmericaLatviaLebanonLiberiaLithuaniaMalaysiaMexicoMicronesiaMiddle AfricaMoldovaMoroccoNepalNetherlandsNicaraguaNigeriaNorth AmericaNorth MacedoniaNorthern AfricaNorthern EuropeNorwayOceaniaPakistanPanamaPeruPhilippinesPolandPortugalRomaniaRussiaSaudi ArabiaScotlandSenegalSerbiaSierra LeoneSingaporeSomaliaSouth AfricaSouth AmericaSouth Central AsiaSouth Eastern AsiaSouthern EuropeSpainSri LankaSt. Vincent and the GrenadinesSudanSwedenSwitzerlandSyriaTaiwanThailandTrinidad and TobagoTurkeyUgandaUkraineUruguayUzbekistanVenezuelaVietnamWest IndiesWestern AfricaWestern AsiaWestern EuropeYemenZaireZimbabweAzores
Child Poverty Among Girls Under 16
Income
Poverty
Unemployment
Labor Participation
Family Structure
Vehicle Availability
Education Level
Disability

Child Poverty Among Girls Under 16 Comparison

Immigrants from Belarus

Immigrants from Japan

Exceptional
Exceptional
14.8%
CHILD POVERTY AMONG GIRLS UNDER 16
97.0/ 100
METRIC RATING
91st/ 347
METRIC RANK
13.3%
CHILD POVERTY AMONG GIRLS UNDER 16
99.9/ 100
METRIC RATING
20th/ 347
METRIC RANK

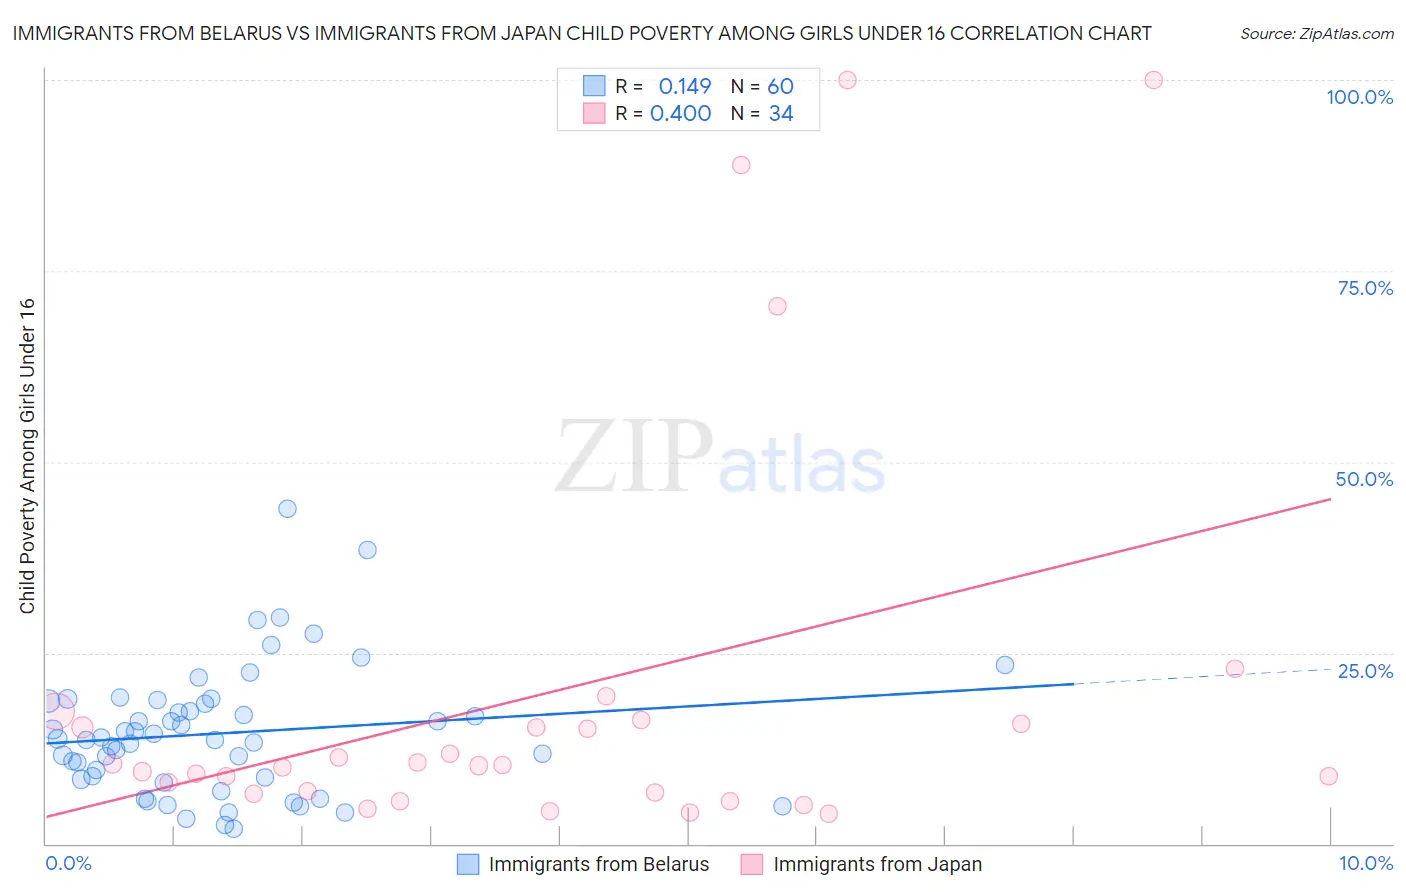
Immigrants from Belarus vs Immigrants from Japan Child Poverty Among Girls Under 16 Correlation Chart

The statistical analysis conducted on geographies consisting of 148,734,264 people shows a poor positive correlation between the proportion of Immigrants from Belarus and poverty level among girls under the age of 16 in the United States with a correlation coefficient (R) of 0.149 and weighted average of 14.8%. Similarly, the statistical analysis conducted on geographies consisting of 334,926,673 people shows a moderate positive correlation between the proportion of Immigrants from Japan and poverty level among girls under the age of 16 in the United States with a correlation coefficient (R) of 0.400 and weighted average of 13.3%, a difference of 11.6%.
Immigrants from Belarus vs Immigrants from Japan Child Poverty Among Girls Under 16

Child Poverty Among Girls Under 16 Correlation Summary

MeasurementImmigrants from BelarusImmigrants from Japan
Minimum2.0%3.9%
Maximum43.9%100.0%
Range41.9%96.1%
Mean14.5%19.7%
Median13.7%10.3%
Interquartile 25% (IQ1)8.5%6.7%
Interquartile 75% (IQ3)18.5%15.7%
Interquartile Range (IQR)9.9%9.1%
Standard Deviation (Sample)8.4%26.7%
Standard Deviation (Population)8.3%26.4%

Similar Demographics by Child Poverty Among Girls Under 16

Demographics Similar to Immigrants from Belarus by Child Poverty Among Girls Under 16

In terms of child poverty among girls under 16, the demographic groups most similar to Immigrants from Belarus are Northern European (14.8%, a difference of 0.040%), Jordanian (14.8%, a difference of 0.060%), Immigrants from Canada (14.8%, a difference of 0.11%), Finnish (14.8%, a difference of 0.18%), and Australian (14.8%, a difference of 0.20%).
DemographicsRating | RankChild Poverty Among Girls Under 16
Soviet Union
97.3
/100
|
#84
Exceptional
14.8%
Swiss
97.2
/100
|
#85
Exceptional
14.8%
Australians
97.2
/100
|
#86
Exceptional
14.8%
Finns
97.2
/100
|
#87
Exceptional
14.8%
Immigrants | Canada
97.1
/100
|
#88
Exceptional
14.8%
Jordanians
97.1
/100
|
#89
Exceptional
14.8%
Northern Europeans
97.0
/100
|
#90
Exceptional
14.8%
Immigrants | Belarus
97.0
/100
|
#91
Exceptional
14.8%
Austrians
96.7
/100
|
#92
Exceptional
14.9%
Immigrants | North America
96.6
/100
|
#93
Exceptional
14.9%
Immigrants | Switzerland
96.3
/100
|
#94
Exceptional
14.9%
Germans
96.3
/100
|
#95
Exceptional
14.9%
Immigrants | France
96.2
/100
|
#96
Exceptional
14.9%
Immigrants | Latvia
96.1
/100
|
#97
Exceptional
14.9%
Basques
95.9
/100
|
#98
Exceptional
15.0%

Demographics Similar to Immigrants from Japan by Child Poverty Among Girls Under 16

In terms of child poverty among girls under 16, the demographic groups most similar to Immigrants from Japan are Assyrian/Chaldean/Syriac (13.3%, a difference of 0.12%), Indian (Asian) (13.3%, a difference of 0.32%), Norwegian (13.3%, a difference of 0.49%), Immigrants from Eastern Asia (13.4%, a difference of 0.58%), and Cypriot (13.2%, a difference of 0.66%).
DemographicsRating | RankChild Poverty Among Girls Under 16
Immigrants | Ireland
99.9
/100
|
#13
Exceptional
12.9%
Burmese
99.9
/100
|
#14
Exceptional
13.0%
Okinawans
99.9
/100
|
#15
Exceptional
13.0%
Immigrants | Lithuania
99.9
/100
|
#16
Exceptional
13.1%
Bulgarians
99.9
/100
|
#17
Exceptional
13.1%
Immigrants | Korea
99.9
/100
|
#18
Exceptional
13.1%
Cypriots
99.9
/100
|
#19
Exceptional
13.2%
Immigrants | Japan
99.9
/100
|
#20
Exceptional
13.3%
Assyrians/Chaldeans/Syriacs
99.9
/100
|
#21
Exceptional
13.3%
Indians (Asian)
99.9
/100
|
#22
Exceptional
13.3%
Norwegians
99.9
/100
|
#23
Exceptional
13.3%
Immigrants | Eastern Asia
99.9
/100
|
#24
Exceptional
13.4%
Immigrants | China
99.8
/100
|
#25
Exceptional
13.4%
Eastern Europeans
99.8
/100
|
#26
Exceptional
13.5%
Latvians
99.8
/100
|
#27
Exceptional
13.5%