Immigrants from Bahamas vs Israeli Single Father Poverty

COMPARE

Immigrants from Bahamas
Race
Ancestry
AfghanAfricanAlaska NativeAlaskan AthabascanAlbanianAleutAlsatianAmericanApacheArabArapahoArgentineanArmenianAssyrian/Chaldean/SyriacAustralianAustrianBahamianBangladeshiBarbadianBasqueBelgianBelizeanBermudanBhutaneseBlackfeetBolivianBrazilianBritishBritish West IndianBulgarianBurmeseCajunCambodianCanadianCape VerdeanCarpatho RusynCelticCentral AmericanCentral American IndianCherokeeCheyenneChickasawChileanChineseChippewaChoctawColombianColvilleComancheCosta RicanCreeCreekCroatianCrowCubanCypriotCzechCzechoslovakianDanishDelawareDominicanDutchDutch West IndianEastern EuropeanEcuadorianEgyptianEnglishEstonianEthiopianEuropeanFijianFilipinoFinnishFrenchFrench American IndianFrench CanadianGermanGerman RussianGhanaianGreekGuamanian/ChamorroGuatemalanGuyaneseHaitianHmongHonduranHopiHoumaHungarianIcelanderIndian (Asian)IndonesianInupiatIranianIraqiIrishIroquoisItalianJamaicanJapaneseJordanianKenyanKiowaKoreanLaotianLatvianLebaneseLiberianLithuanianLumbeeLuxembourgerMacedonianMalaysianMalteseMarshalleseMenomineeMexicanMexican American IndianMongolianMoroccanNative HawaiianNavajoNepaleseNew ZealanderNicaraguanNigerianNorthern EuropeanNorwegianOkinawanOsageOttawaPaiutePakistaniPalestinianPanamanianParaguayanPennsylvania GermanPeruvianPimaPolishPortuguesePotawatomiPuebloPuerto RicanPuget Sound SalishRomanianRussianSalvadoranSamoanScandinavianScotch-IrishScottishSeminoleSenegaleseSerbianShoshoneSierra LeoneanSiouxSlavicSlovakSloveneSomaliSouth AfricanSouth AmericanSouth American IndianSoviet UnionSpaniardSpanishSpanish AmericanSpanish American IndianSri LankanSubsaharan AfricanSudaneseSwedishSwissSyrianTaiwaneseThaiTlingit-HaidaTohono O'OdhamTonganTrinidadian and TobagonianTsimshianTurkishU.S. Virgin IslanderUgandanUkrainianUruguayanUteVenezuelanVietnameseWelshWest IndianYakamaYaquiYugoslavianYumanYup'ikZimbabwean
Immigration
NonimmigrantsImmigrantsAfghanistanAfricaAlbaniaArgentinaArmeniaAsiaAustraliaAustriaBahamasBangladeshBarbadosBelarusBelgiumBelizeBoliviaBosnia and HerzegovinaBrazilBulgariaBurma/MyanmarCabo VerdeCambodiaCameroonCanadaCaribbeanCentral AmericaChileChinaColombiaCongoCosta RicaCroatiaCubaCzechoslovakiaDenmarkDominicaDominican RepublicEastern AfricaEastern AsiaEastern EuropeEcuadorEgyptEl SalvadorEnglandEritreaEthiopiaEuropeFijiFranceGermanyGhanaGreeceGrenadaGuatemalaGuyanaHaitiHondurasHong KongHungaryIndiaIndonesiaIranIraqIrelandIsraelItalyJamaicaJapanJordanKazakhstanKenyaKoreaKuwaitLaosLatin AmericaLatviaLebanonLiberiaLithuaniaMalaysiaMexicoMicronesiaMiddle AfricaMoldovaMoroccoNepalNetherlandsNicaraguaNigeriaNorth AmericaNorth MacedoniaNorthern AfricaNorthern EuropeNorwayOceaniaPakistanPanamaPeruPhilippinesPolandPortugalRomaniaRussiaSaudi ArabiaScotlandSenegalSerbiaSierra LeoneSingaporeSomaliaSouth AfricaSouth AmericaSouth Central AsiaSouth Eastern AsiaSouthern EuropeSpainSri LankaSt. Vincent and the GrenadinesSudanSwedenSwitzerlandSyriaTaiwanThailandTrinidad and TobagoTurkeyUgandaUkraineUruguayUzbekistanVenezuelaVietnamWest IndiesWestern AfricaWestern AsiaWestern EuropeYemenZaireZimbabweAzores
Israeli
Race
Ancestry
AfghanAfricanAlaska NativeAlaskan AthabascanAlbanianAleutAlsatianAmericanApacheArabArapahoArgentineanArmenianAssyrian/Chaldean/SyriacAustralianAustrianBahamianBangladeshiBarbadianBasqueBelgianBelizeanBermudanBhutaneseBlackfeetBolivianBrazilianBritishBritish West IndianBulgarianBurmeseCajunCambodianCanadianCape VerdeanCarpatho RusynCelticCentral AmericanCentral American IndianCherokeeCheyenneChickasawChileanChineseChippewaChoctawColombianColvilleComancheCosta RicanCreeCreekCroatianCrowCubanCypriotCzechCzechoslovakianDanishDelawareDominicanDutchDutch West IndianEastern EuropeanEcuadorianEgyptianEnglishEstonianEthiopianEuropeanFijianFilipinoFinnishFrenchFrench American IndianFrench CanadianGermanGerman RussianGhanaianGreekGuamanian/ChamorroGuatemalanGuyaneseHaitianHmongHonduranHopiHoumaHungarianIcelanderIndian (Asian)IndonesianInupiatIranianIraqiIrishIroquoisIsraeliItalianJamaicanJapaneseJordanianKenyanKiowaKoreanLaotianLatvianLebaneseLiberianLithuanianLumbeeLuxembourgerMacedonianMalaysianMalteseMarshalleseMenomineeMexicanMexican American IndianMongolianMoroccanNative HawaiianNavajoNepaleseNew ZealanderNicaraguanNigerianNorthern EuropeanNorwegianOkinawanOsageOttawaPaiutePakistaniPalestinianPanamanianParaguayanPennsylvania GermanPeruvianPimaPolishPortuguesePotawatomiPuebloPuerto RicanPuget Sound SalishRomanianRussianSalvadoranSamoanScandinavianScotch-IrishScottishSeminoleSenegaleseSerbianShoshoneSierra LeoneanSiouxSlavicSlovakSloveneSomaliSouth AfricanSouth AmericanSouth American IndianSoviet UnionSpaniardSpanishSpanish AmericanSpanish American IndianSri LankanSubsaharan AfricanSudaneseSwedishSwissSyrianTaiwaneseThaiTlingit-HaidaTohono O'OdhamTonganTrinidadian and TobagonianTsimshianTurkishU.S. Virgin IslanderUgandanUkrainianUruguayanUteVenezuelanVietnameseWelshWest IndianYakamaYaquiYugoslavianYumanYup'ikZimbabwean
Immigration
NonimmigrantsImmigrantsAfghanistanAfricaAlbaniaArgentinaArmeniaAsiaAustraliaAustriaBangladeshBarbadosBelarusBelgiumBelizeBoliviaBosnia and HerzegovinaBrazilBulgariaBurma/MyanmarCabo VerdeCambodiaCameroonCanadaCaribbeanCentral AmericaChileChinaColombiaCongoCosta RicaCroatiaCubaCzechoslovakiaDenmarkDominicaDominican RepublicEastern AfricaEastern AsiaEastern EuropeEcuadorEgyptEl SalvadorEnglandEritreaEthiopiaEuropeFijiFranceGermanyGhanaGreeceGrenadaGuatemalaGuyanaHaitiHondurasHong KongHungaryIndiaIndonesiaIranIraqIrelandIsraelItalyJamaicaJapanJordanKazakhstanKenyaKoreaKuwaitLaosLatin AmericaLatviaLebanonLiberiaLithuaniaMalaysiaMexicoMicronesiaMiddle AfricaMoldovaMoroccoNepalNetherlandsNicaraguaNigeriaNorth AmericaNorth MacedoniaNorthern AfricaNorthern EuropeNorwayOceaniaPakistanPanamaPeruPhilippinesPolandPortugalRomaniaRussiaSaudi ArabiaScotlandSenegalSerbiaSierra LeoneSingaporeSomaliaSouth AfricaSouth AmericaSouth Central AsiaSouth Eastern AsiaSouthern EuropeSpainSri LankaSt. Vincent and the GrenadinesSudanSwedenSwitzerlandSyriaTaiwanThailandTrinidad and TobagoTurkeyUgandaUkraineUruguayUzbekistanVenezuelaVietnamWest IndiesWestern AfricaWestern AsiaWestern EuropeYemenZaireZimbabweAzores
Single Father Poverty
Income
Poverty
Unemployment
Labor Participation
Family Structure
Vehicle Availability
Education Level
Disability

Single Father Poverty Comparison

Immigrants from Bahamas

Israelis

Tragic
Tragic
18.1%
SINGLE FATHER POVERTY
0.0/ 100
METRIC RATING
292nd/ 347
METRIC RANK
16.8%
SINGLE FATHER POVERTY
4.6/ 100
METRIC RATING
229th/ 347
METRIC RANK

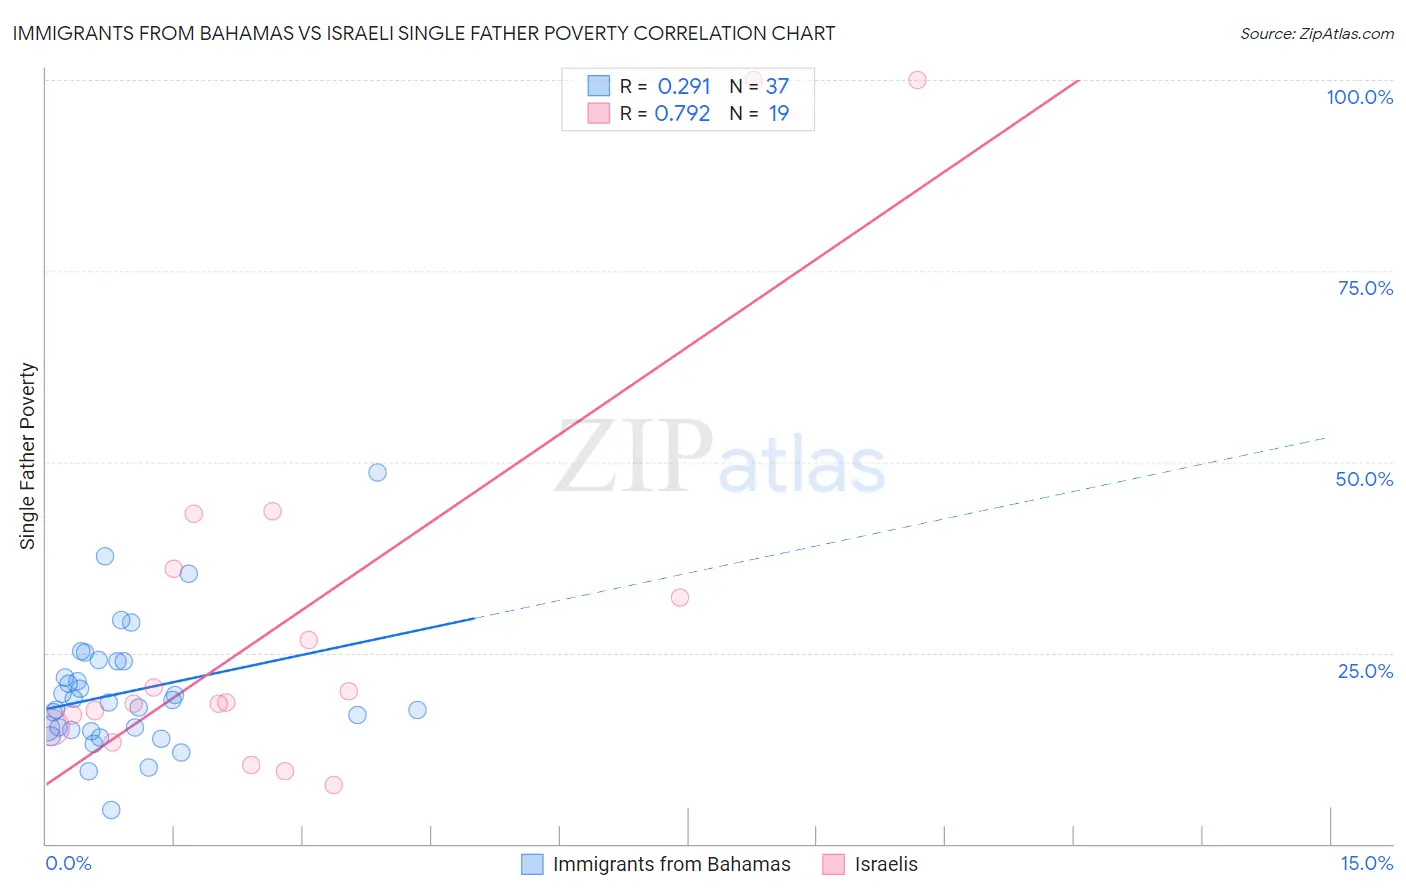
Immigrants from Bahamas vs Israeli Single Father Poverty Correlation Chart

The statistical analysis conducted on geographies consisting of 96,162,173 people shows a weak positive correlation between the proportion of Immigrants from Bahamas and poverty level among single fathers in the United States with a correlation coefficient (R) of 0.291 and weighted average of 18.1%. Similarly, the statistical analysis conducted on geographies consisting of 176,564,274 people shows a strong positive correlation between the proportion of Israelis and poverty level among single fathers in the United States with a correlation coefficient (R) of 0.792 and weighted average of 16.8%, a difference of 7.4%.
Immigrants from Bahamas vs Israeli Single Father Poverty

Single Father Poverty Correlation Summary

MeasurementImmigrants from BahamasIsraeli
Minimum4.5%7.8%
Maximum48.6%100.0%
Range44.1%92.2%
Mean19.9%29.9%
Median18.6%18.5%
Interquartile 25% (IQ1)14.8%15.2%
Interquartile 75% (IQ3)23.9%35.9%
Interquartile Range (IQR)9.1%20.7%
Standard Deviation (Sample)8.3%26.8%
Standard Deviation (Population)8.2%26.1%

Similar Demographics by Single Father Poverty

Demographics Similar to Immigrants from Bahamas by Single Father Poverty

In terms of single father poverty, the demographic groups most similar to Immigrants from Bahamas are Alaskan Athabascan (18.1%, a difference of 0.010%), Alaska Native (18.1%, a difference of 0.11%), U.S. Virgin Islander (18.1%, a difference of 0.13%), Yakama (18.1%, a difference of 0.20%), and West Indian (18.0%, a difference of 0.23%).
DemographicsRating | RankSingle Father Poverty
Immigrants | Lebanon
0.0
/100
|
#285
Tragic
17.9%
Immigrants | North Macedonia
0.0
/100
|
#286
Tragic
17.9%
Carpatho Rusyns
0.0
/100
|
#287
Tragic
18.0%
Bahamians
0.0
/100
|
#288
Tragic
18.0%
Irish
0.0
/100
|
#289
Tragic
18.0%
West Indians
0.0
/100
|
#290
Tragic
18.0%
Alaskan Athabascans
0.0
/100
|
#291
Tragic
18.1%
Immigrants | Bahamas
0.0
/100
|
#292
Tragic
18.1%
Alaska Natives
0.0
/100
|
#293
Tragic
18.1%
U.S. Virgin Islanders
0.0
/100
|
#294
Tragic
18.1%
Yakama
0.0
/100
|
#295
Tragic
18.1%
Seminole
0.0
/100
|
#296
Tragic
18.1%
French
0.0
/100
|
#297
Tragic
18.2%
Africans
0.0
/100
|
#298
Tragic
18.3%
Whites/Caucasians
0.0
/100
|
#299
Tragic
18.4%

Demographics Similar to Israelis by Single Father Poverty

In terms of single father poverty, the demographic groups most similar to Israelis are Immigrants from Trinidad and Tobago (16.8%, a difference of 0.030%), Belgian (16.8%, a difference of 0.16%), British (16.8%, a difference of 0.22%), Spanish American (16.9%, a difference of 0.24%), and Immigrants from Grenada (16.9%, a difference of 0.26%).
DemographicsRating | RankSingle Father Poverty
Immigrants | Spain
8.0
/100
|
#222
Tragic
16.7%
Immigrants | Austria
7.0
/100
|
#223
Tragic
16.8%
Immigrants | Norway
6.5
/100
|
#224
Tragic
16.8%
Menominee
6.4
/100
|
#225
Tragic
16.8%
Hispanics or Latinos
6.1
/100
|
#226
Tragic
16.8%
British
5.6
/100
|
#227
Tragic
16.8%
Belgians
5.3
/100
|
#228
Tragic
16.8%
Israelis
4.6
/100
|
#229
Tragic
16.8%
Immigrants | Trinidad and Tobago
4.5
/100
|
#230
Tragic
16.8%
Spanish Americans
3.7
/100
|
#231
Tragic
16.9%
Immigrants | Grenada
3.7
/100
|
#232
Tragic
16.9%
Senegalese
3.2
/100
|
#233
Tragic
16.9%
Marshallese
3.1
/100
|
#234
Tragic
16.9%
Immigrants | Western Europe
2.9
/100
|
#235
Tragic
16.9%
Immigrants | Germany
2.9
/100
|
#236
Tragic
16.9%