Immigrants from Asia vs Venezuelan Single Male Poverty
COMPARE
Immigrants from Asia
Venezuelan
Single Male Poverty
Single Male Poverty Comparison
Immigrants from Asia
Venezuelans
11.4%
SINGLE MALE POVERTY
100.0/ 100
METRIC RATING
28th/ 347
METRIC RANK
12.4%
SINGLE MALE POVERTY
89.4/ 100
METRIC RATING
120th/ 347
METRIC RANK
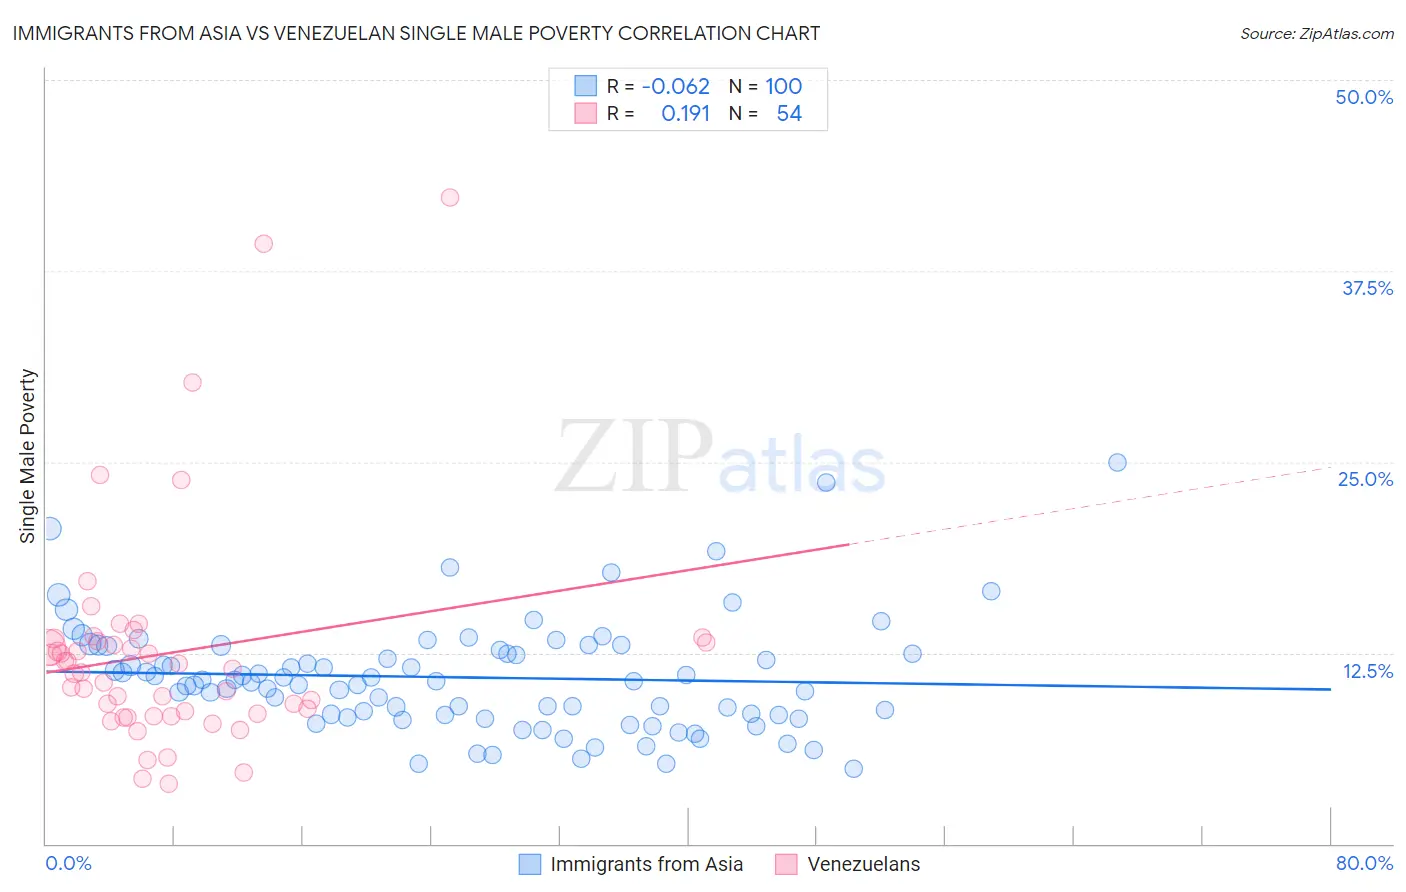
Immigrants from Asia vs Venezuelan Single Male Poverty Correlation Chart
The statistical analysis conducted on geographies consisting of 461,688,534 people shows a slight negative correlation between the proportion of Immigrants from Asia and poverty level among single males in the United States with a correlation coefficient (R) of -0.062 and weighted average of 11.4%. Similarly, the statistical analysis conducted on geographies consisting of 278,649,503 people shows a poor positive correlation between the proportion of Venezuelans and poverty level among single males in the United States with a correlation coefficient (R) of 0.191 and weighted average of 12.4%, a difference of 9.2%.
Single Male Poverty Correlation Summary
| Measurement | Immigrants from Asia | Venezuelan |
| Minimum | 4.9% | 3.9% |
| Maximum | 25.0% | 42.3% |
| Range | 20.1% | 38.4% |
| Mean | 10.9% | 12.5% |
| Median | 10.6% | 11.3% |
| Interquartile 25% (IQ1) | 8.4% | 8.5% |
| Interquartile 75% (IQ3) | 12.8% | 13.2% |
| Interquartile Range (IQR) | 4.4% | 4.7% |
| Standard Deviation (Sample) | 3.7% | 7.3% |
| Standard Deviation (Population) | 3.6% | 7.2% |
Similar Demographics by Single Male Poverty
Demographics Similar to Immigrants from Asia by Single Male Poverty
In terms of single male poverty, the demographic groups most similar to Immigrants from Asia are Immigrants from China (11.4%, a difference of 0.070%), Immigrants from Egypt (11.4%, a difference of 0.10%), Iranian (11.4%, a difference of 0.16%), Immigrants from Iran (11.4%, a difference of 0.25%), and Immigrants from Eastern Asia (11.4%, a difference of 0.34%).
| Demographics | Rating | Rank | Single Male Poverty |
| Asians | 100.0 /100 | #21 | Exceptional 11.2% |
| Immigrants | Pakistan | 100.0 /100 | #22 | Exceptional 11.2% |
| Bolivians | 100.0 /100 | #23 | Exceptional 11.2% |
| Indians (Asian) | 100.0 /100 | #24 | Exceptional 11.3% |
| Maltese | 100.0 /100 | #25 | Exceptional 11.3% |
| Immigrants | Japan | 100.0 /100 | #26 | Exceptional 11.3% |
| Immigrants | China | 100.0 /100 | #27 | Exceptional 11.4% |
| Immigrants | Asia | 100.0 /100 | #28 | Exceptional 11.4% |
| Immigrants | Egypt | 100.0 /100 | #29 | Exceptional 11.4% |
| Iranians | 100.0 /100 | #30 | Exceptional 11.4% |
| Immigrants | Iran | 100.0 /100 | #31 | Exceptional 11.4% |
| Immigrants | Eastern Asia | 100.0 /100 | #32 | Exceptional 11.4% |
| Immigrants | Vietnam | 100.0 /100 | #33 | Exceptional 11.4% |
| Immigrants | Ethiopia | 100.0 /100 | #34 | Exceptional 11.4% |
| Immigrants | South Eastern Asia | 100.0 /100 | #35 | Exceptional 11.4% |
Demographics Similar to Venezuelans by Single Male Poverty
In terms of single male poverty, the demographic groups most similar to Venezuelans are Immigrants from Albania (12.4%, a difference of 0.14%), Icelander (12.5%, a difference of 0.16%), Albanian (12.4%, a difference of 0.17%), Serbian (12.5%, a difference of 0.21%), and Immigrants from Kenya (12.5%, a difference of 0.24%).
| Demographics | Rating | Rank | Single Male Poverty |
| Pakistanis | 92.4 /100 | #113 | Exceptional 12.4% |
| Nicaraguans | 92.1 /100 | #114 | Exceptional 12.4% |
| Immigrants | Southern Europe | 91.5 /100 | #115 | Exceptional 12.4% |
| Immigrants | Syria | 91.2 /100 | #116 | Exceptional 12.4% |
| Immigrants | Oceania | 91.1 /100 | #117 | Exceptional 12.4% |
| Albanians | 90.6 /100 | #118 | Exceptional 12.4% |
| Immigrants | Albania | 90.3 /100 | #119 | Exceptional 12.4% |
| Venezuelans | 89.4 /100 | #120 | Excellent 12.4% |
| Icelanders | 88.2 /100 | #121 | Excellent 12.5% |
| Serbians | 87.9 /100 | #122 | Excellent 12.5% |
| Immigrants | Kenya | 87.6 /100 | #123 | Excellent 12.5% |
| Russians | 87.3 /100 | #124 | Excellent 12.5% |
| Immigrants | Jordan | 87.1 /100 | #125 | Excellent 12.5% |
| Romanians | 86.4 /100 | #126 | Excellent 12.5% |
| Immigrants | Netherlands | 86.2 /100 | #127 | Excellent 12.5% |