Immigrants from Armenia vs Immigrants from Latin America Seniors Poverty Over the Age of 65

COMPARE

Immigrants from Armenia
Race
Ancestry
AfghanAfricanAlaska NativeAlaskan AthabascanAlbanianAleutAlsatianAmericanApacheArabArapahoArgentineanArmenianAssyrian/Chaldean/SyriacAustralianAustrianBahamianBangladeshiBarbadianBasqueBelgianBelizeanBermudanBhutaneseBlackfeetBolivianBrazilianBritishBritish West IndianBulgarianBurmeseCajunCambodianCanadianCape VerdeanCarpatho RusynCelticCentral AmericanCentral American IndianCherokeeCheyenneChickasawChileanChineseChippewaChoctawColombianColvilleComancheCosta RicanCreeCreekCroatianCrowCubanCypriotCzechCzechoslovakianDanishDelawareDominicanDutchDutch West IndianEastern EuropeanEcuadorianEgyptianEnglishEstonianEthiopianEuropeanFijianFilipinoFinnishFrenchFrench American IndianFrench CanadianGermanGerman RussianGhanaianGreekGuamanian/ChamorroGuatemalanGuyaneseHaitianHmongHonduranHopiHoumaHungarianIcelanderIndian (Asian)IndonesianInupiatIranianIraqiIrishIroquoisIsraeliItalianJamaicanJapaneseJordanianKenyanKiowaKoreanLaotianLatvianLebaneseLiberianLithuanianLumbeeLuxembourgerMacedonianMalaysianMalteseMarshalleseMenomineeMexicanMexican American IndianMongolianMoroccanNative HawaiianNavajoNepaleseNew ZealanderNicaraguanNigerianNorthern EuropeanNorwegianOkinawanOsageOttawaPaiutePakistaniPalestinianPanamanianParaguayanPennsylvania GermanPeruvianPimaPolishPortuguesePotawatomiPuebloPuerto RicanPuget Sound SalishRomanianRussianSalvadoranSamoanScandinavianScotch-IrishScottishSeminoleSenegaleseSerbianShoshoneSierra LeoneanSiouxSlavicSlovakSloveneSomaliSouth AfricanSouth AmericanSouth American IndianSoviet UnionSpaniardSpanishSpanish AmericanSpanish American IndianSri LankanSubsaharan AfricanSudaneseSwedishSwissSyrianTaiwaneseThaiTlingit-HaidaTohono O'OdhamTonganTrinidadian and TobagonianTsimshianTurkishU.S. Virgin IslanderUgandanUkrainianUruguayanUteVenezuelanVietnameseWelshWest IndianYakamaYaquiYugoslavianYumanYup'ikZimbabwean
Immigration
NonimmigrantsImmigrantsAfghanistanAfricaAlbaniaArgentinaArmeniaAsiaAustraliaAustriaBahamasBangladeshBarbadosBelarusBelgiumBelizeBoliviaBosnia and HerzegovinaBrazilBulgariaBurma/MyanmarCabo VerdeCambodiaCameroonCanadaCaribbeanCentral AmericaChileChinaColombiaCongoCosta RicaCroatiaCubaCzechoslovakiaDenmarkDominicaDominican RepublicEastern AfricaEastern AsiaEastern EuropeEcuadorEgyptEl SalvadorEnglandEritreaEthiopiaEuropeFijiFranceGermanyGhanaGreeceGrenadaGuatemalaGuyanaHaitiHondurasHong KongHungaryIndiaIndonesiaIranIraqIrelandIsraelItalyJamaicaJapanJordanKazakhstanKenyaKoreaKuwaitLaosLatviaLebanonLiberiaLithuaniaMalaysiaMexicoMicronesiaMiddle AfricaMoldovaMoroccoNepalNetherlandsNicaraguaNigeriaNorth AmericaNorth MacedoniaNorthern AfricaNorthern EuropeNorwayOceaniaPakistanPanamaPeruPhilippinesPolandPortugalRomaniaRussiaSaudi ArabiaScotlandSenegalSerbiaSierra LeoneSingaporeSomaliaSouth AfricaSouth AmericaSouth Central AsiaSouth Eastern AsiaSouthern EuropeSpainSri LankaSt. Vincent and the GrenadinesSudanSwedenSwitzerlandSyriaTaiwanThailandTrinidad and TobagoTurkeyUgandaUkraineUruguayUzbekistanVenezuelaVietnamWest IndiesWestern AfricaWestern AsiaWestern EuropeYemenZaireZimbabweAzores
Immigrants from Latin America
Race
Ancestry
AfghanAfricanAlaska NativeAlaskan AthabascanAlbanianAleutAlsatianAmericanApacheArabArapahoArgentineanArmenianAssyrian/Chaldean/SyriacAustralianAustrianBahamianBangladeshiBarbadianBasqueBelgianBelizeanBermudanBhutaneseBlackfeetBolivianBrazilianBritishBritish West IndianBulgarianBurmeseCajunCambodianCanadianCape VerdeanCarpatho RusynCelticCentral AmericanCentral American IndianCherokeeCheyenneChickasawChileanChineseChippewaChoctawColombianColvilleComancheCosta RicanCreeCreekCroatianCrowCubanCypriotCzechCzechoslovakianDanishDelawareDominicanDutchDutch West IndianEastern EuropeanEcuadorianEgyptianEnglishEstonianEthiopianEuropeanFijianFilipinoFinnishFrenchFrench American IndianFrench CanadianGermanGerman RussianGhanaianGreekGuamanian/ChamorroGuatemalanGuyaneseHaitianHmongHonduranHopiHoumaHungarianIcelanderIndian (Asian)IndonesianInupiatIranianIraqiIrishIroquoisIsraeliItalianJamaicanJapaneseJordanianKenyanKiowaKoreanLaotianLatvianLebaneseLiberianLithuanianLumbeeLuxembourgerMacedonianMalaysianMalteseMarshalleseMenomineeMexicanMexican American IndianMongolianMoroccanNative HawaiianNavajoNepaleseNew ZealanderNicaraguanNigerianNorthern EuropeanNorwegianOkinawanOsageOttawaPaiutePakistaniPalestinianPanamanianParaguayanPennsylvania GermanPeruvianPimaPolishPortuguesePotawatomiPuebloPuerto RicanPuget Sound SalishRomanianRussianSalvadoranSamoanScandinavianScotch-IrishScottishSeminoleSenegaleseSerbianShoshoneSierra LeoneanSiouxSlavicSlovakSloveneSomaliSouth AfricanSouth AmericanSouth American IndianSoviet UnionSpaniardSpanishSpanish AmericanSpanish American IndianSri LankanSubsaharan AfricanSudaneseSwedishSwissSyrianTaiwaneseThaiTlingit-HaidaTohono O'OdhamTonganTrinidadian and TobagonianTsimshianTurkishU.S. Virgin IslanderUgandanUkrainianUruguayanUteVenezuelanVietnameseWelshWest IndianYakamaYaquiYugoslavianYumanYup'ikZimbabwean
Immigration
NonimmigrantsImmigrantsAfghanistanAfricaAlbaniaArgentinaAsiaAustraliaAustriaBahamasBangladeshBarbadosBelarusBelgiumBelizeBoliviaBosnia and HerzegovinaBrazilBulgariaBurma/MyanmarCabo VerdeCambodiaCameroonCanadaCaribbeanCentral AmericaChileChinaColombiaCongoCosta RicaCroatiaCubaCzechoslovakiaDenmarkDominicaDominican RepublicEastern AfricaEastern AsiaEastern EuropeEcuadorEgyptEl SalvadorEnglandEritreaEthiopiaEuropeFijiFranceGermanyGhanaGreeceGrenadaGuatemalaGuyanaHaitiHondurasHong KongHungaryIndiaIndonesiaIranIraqIrelandIsraelItalyJamaicaJapanJordanKazakhstanKenyaKoreaKuwaitLaosLatin AmericaLatviaLebanonLiberiaLithuaniaMalaysiaMexicoMicronesiaMiddle AfricaMoldovaMoroccoNepalNetherlandsNicaraguaNigeriaNorth AmericaNorth MacedoniaNorthern AfricaNorthern EuropeNorwayOceaniaPakistanPanamaPeruPhilippinesPolandPortugalRomaniaRussiaSaudi ArabiaScotlandSenegalSerbiaSierra LeoneSingaporeSomaliaSouth AfricaSouth AmericaSouth Central AsiaSouth Eastern AsiaSouthern EuropeSpainSri LankaSt. Vincent and the GrenadinesSudanSwedenSwitzerlandSyriaTaiwanThailandTrinidad and TobagoTurkeyUgandaUkraineUruguayUzbekistanVenezuelaVietnamWest IndiesWestern AfricaWestern AsiaWestern EuropeYemenZaireZimbabweAzores
Seniors Poverty Over the Age of 65
Income
Poverty
Unemployment
Labor Participation
Family Structure
Vehicle Availability
Education Level
Disability

Seniors Poverty Over the Age of 65 Comparison

Immigrants from Armenia

Immigrants from Latin America

Tragic
Tragic
15.2%
SENIORS POVERTY OVER THE AGE OF 65
0.0/ 100
METRIC RATING
326th/ 347
METRIC RANK
14.2%
SENIORS POVERTY OVER THE AGE OF 65
0.0/ 100
METRIC RATING
306th/ 347
METRIC RANK

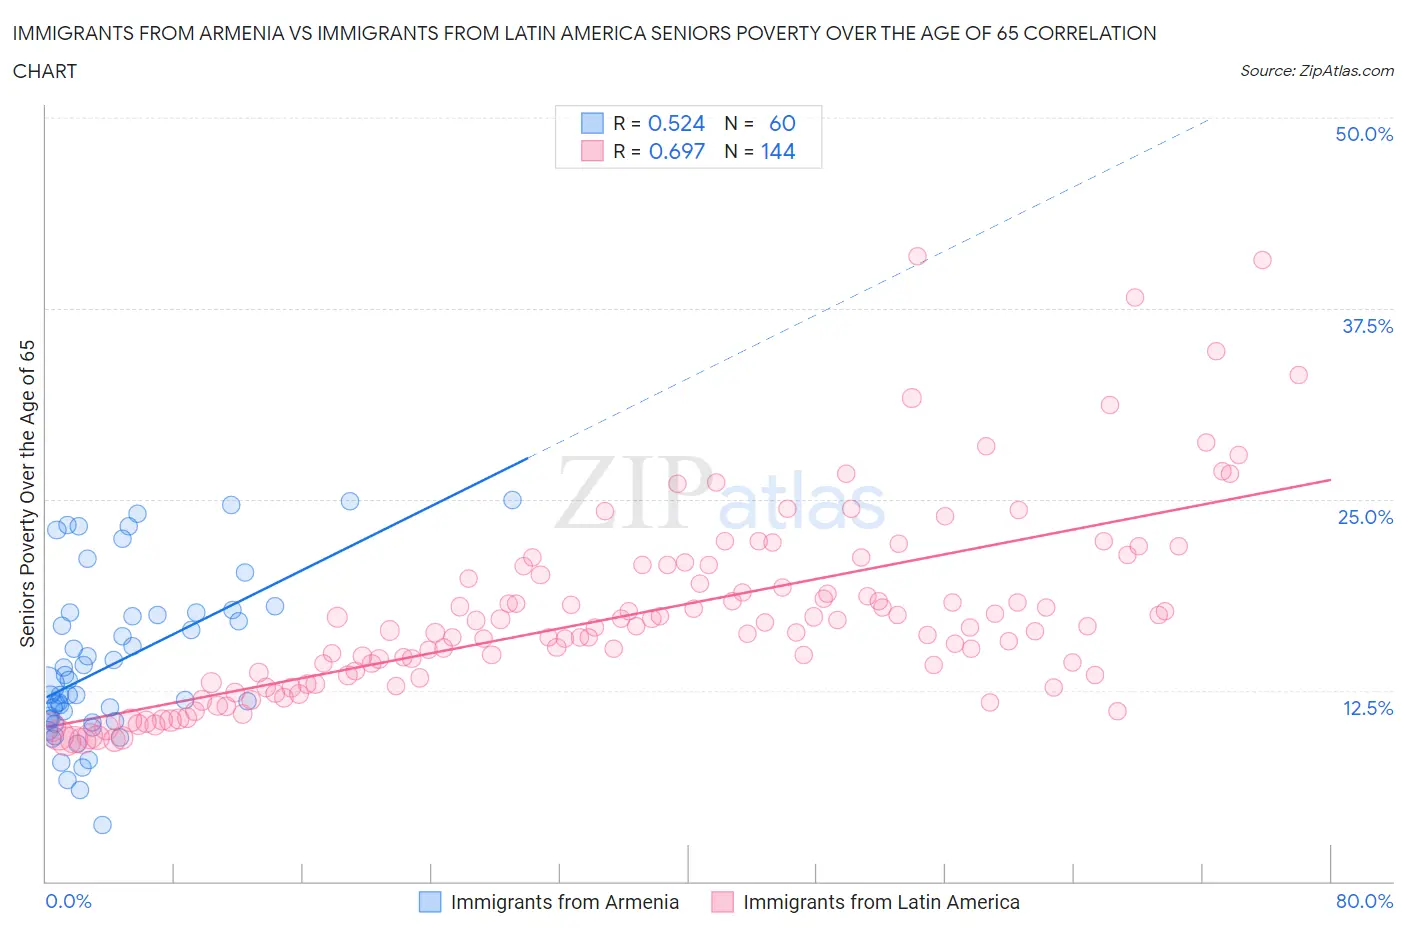
Immigrants from Armenia vs Immigrants from Latin America Seniors Poverty Over the Age of 65 Correlation Chart

The statistical analysis conducted on geographies consisting of 97,583,648 people shows a substantial positive correlation between the proportion of Immigrants from Armenia and poverty level among seniors over the age of 65 in the United States with a correlation coefficient (R) of 0.524 and weighted average of 15.2%. Similarly, the statistical analysis conducted on geographies consisting of 554,058,835 people shows a significant positive correlation between the proportion of Immigrants from Latin America and poverty level among seniors over the age of 65 in the United States with a correlation coefficient (R) of 0.697 and weighted average of 14.2%, a difference of 7.2%.
Immigrants from Armenia vs Immigrants from Latin America Seniors Poverty Over the Age of 65

Seniors Poverty Over the Age of 65 Correlation Summary

MeasurementImmigrants from ArmeniaImmigrants from Latin America
Minimum3.6%9.2%
Maximum25.0%41.0%
Range21.4%31.8%
Mean14.3%17.4%
Median12.5%16.5%
Interquartile 25% (IQ1)10.5%13.0%
Interquartile 75% (IQ3)17.5%19.9%
Interquartile Range (IQR)7.0%7.0%
Standard Deviation (Sample)5.3%6.2%
Standard Deviation (Population)5.3%6.2%

Demographics Similar to Immigrants from Armenia and Immigrants from Latin America by Seniors Poverty Over the Age of 65

In terms of seniors poverty over the age of 65, the demographic groups most similar to Immigrants from Armenia are Central American Indian (15.1%, a difference of 0.60%), Nicaraguan (15.0%, a difference of 1.2%), Yakama (14.8%, a difference of 2.6%), Immigrants from Barbados (14.8%, a difference of 2.8%), and Houma (14.7%, a difference of 3.2%). Similarly, the demographic groups most similar to Immigrants from Latin America are Immigrants from West Indies (14.2%, a difference of 0.14%), Trinidadian and Tobagonian (14.2%, a difference of 0.21%), Honduran (14.2%, a difference of 0.31%), Bahamian (14.2%, a difference of 0.57%), and Native/Alaskan (14.2%, a difference of 0.57%).
DemographicsRating | RankSeniors Poverty Over the Age of 65
Immigrants | Latin America
0.0
/100
|
#306
Tragic
14.2%
Immigrants | West Indies
0.0
/100
|
#307
Tragic
14.2%
Trinidadians and Tobagonians
0.0
/100
|
#308
Tragic
14.2%
Hondurans
0.0
/100
|
#309
Tragic
14.2%
Bahamians
0.0
/100
|
#310
Tragic
14.2%
Natives/Alaskans
0.0
/100
|
#311
Tragic
14.2%
Hispanics or Latinos
0.0
/100
|
#312
Tragic
14.3%
Barbadians
0.0
/100
|
#313
Tragic
14.4%
Guyanese
0.0
/100
|
#314
Tragic
14.4%
Immigrants | Ecuador
0.0
/100
|
#315
Tragic
14.4%
Immigrants | Guyana
0.0
/100
|
#316
Tragic
14.5%
Haitians
0.0
/100
|
#317
Tragic
14.5%
Immigrants | Honduras
0.0
/100
|
#318
Tragic
14.5%
Cape Verdeans
0.0
/100
|
#319
Tragic
14.7%
Immigrants | Haiti
0.0
/100
|
#320
Tragic
14.7%
Houma
0.0
/100
|
#321
Tragic
14.7%
Immigrants | Barbados
0.0
/100
|
#322
Tragic
14.8%
Yakama
0.0
/100
|
#323
Tragic
14.8%
Nicaraguans
0.0
/100
|
#324
Tragic
15.0%
Central American Indians
0.0
/100
|
#325
Tragic
15.1%
Immigrants | Armenia
0.0
/100
|
#326
Tragic
15.2%