Immigrants from Argentina vs Immigrants from Trinidad and Tobago Single Father Poverty

COMPARE

Immigrants from Argentina
Race
Ancestry
AfghanAfricanAlaska NativeAlaskan AthabascanAlbanianAleutAlsatianAmericanApacheArabArapahoArgentineanArmenianAssyrian/Chaldean/SyriacAustralianAustrianBahamianBangladeshiBarbadianBasqueBelgianBelizeanBermudanBhutaneseBlackfeetBolivianBrazilianBritishBritish West IndianBulgarianBurmeseCajunCambodianCanadianCape VerdeanCarpatho RusynCelticCentral AmericanCentral American IndianCherokeeCheyenneChickasawChileanChineseChippewaChoctawColombianColvilleComancheCosta RicanCreeCreekCroatianCrowCubanCypriotCzechCzechoslovakianDanishDelawareDominicanDutchDutch West IndianEastern EuropeanEcuadorianEgyptianEnglishEstonianEthiopianEuropeanFijianFilipinoFinnishFrenchFrench American IndianFrench CanadianGermanGerman RussianGhanaianGreekGuamanian/ChamorroGuatemalanGuyaneseHaitianHmongHonduranHopiHoumaHungarianIcelanderIndian (Asian)IndonesianInupiatIranianIraqiIrishIroquoisIsraeliItalianJamaicanJapaneseJordanianKenyanKiowaKoreanLaotianLatvianLebaneseLiberianLithuanianLumbeeLuxembourgerMacedonianMalaysianMalteseMarshalleseMenomineeMexicanMexican American IndianMongolianMoroccanNative HawaiianNavajoNepaleseNew ZealanderNicaraguanNigerianNorthern EuropeanNorwegianOkinawanOsageOttawaPaiutePakistaniPalestinianPanamanianParaguayanPennsylvania GermanPeruvianPimaPolishPortuguesePotawatomiPuebloPuerto RicanPuget Sound SalishRomanianRussianSalvadoranSamoanScandinavianScotch-IrishScottishSeminoleSenegaleseSerbianShoshoneSierra LeoneanSiouxSlavicSlovakSloveneSomaliSouth AfricanSouth AmericanSouth American IndianSoviet UnionSpaniardSpanishSpanish AmericanSpanish American IndianSri LankanSubsaharan AfricanSudaneseSwedishSwissSyrianTaiwaneseThaiTlingit-HaidaTohono O'OdhamTonganTrinidadian and TobagonianTsimshianTurkishU.S. Virgin IslanderUgandanUkrainianUruguayanUteVenezuelanVietnameseWelshWest IndianYakamaYaquiYugoslavianYumanYup'ikZimbabwean
Immigration
NonimmigrantsImmigrantsAfghanistanAfricaAlbaniaArgentinaArmeniaAsiaAustraliaAustriaBahamasBangladeshBarbadosBelarusBelgiumBelizeBoliviaBosnia and HerzegovinaBrazilBulgariaBurma/MyanmarCabo VerdeCambodiaCameroonCanadaCaribbeanCentral AmericaChileChinaColombiaCongoCosta RicaCroatiaCubaCzechoslovakiaDenmarkDominicaDominican RepublicEastern AfricaEastern AsiaEastern EuropeEcuadorEgyptEl SalvadorEnglandEritreaEthiopiaEuropeFijiFranceGermanyGhanaGreeceGrenadaGuatemalaGuyanaHaitiHondurasHong KongHungaryIndiaIndonesiaIranIraqIrelandIsraelItalyJamaicaJapanJordanKazakhstanKenyaKoreaKuwaitLaosLatin AmericaLatviaLebanonLiberiaLithuaniaMalaysiaMexicoMicronesiaMiddle AfricaMoldovaMoroccoNepalNetherlandsNicaraguaNigeriaNorth AmericaNorth MacedoniaNorthern AfricaNorthern EuropeNorwayOceaniaPakistanPanamaPeruPhilippinesPolandPortugalRomaniaRussiaSaudi ArabiaScotlandSenegalSerbiaSierra LeoneSingaporeSomaliaSouth AfricaSouth AmericaSouth Central AsiaSouth Eastern AsiaSouthern EuropeSpainSri LankaSt. Vincent and the GrenadinesSudanSwedenSwitzerlandSyriaTaiwanThailandTurkeyUgandaUkraineUruguayUzbekistanVenezuelaVietnamWest IndiesWestern AfricaWestern AsiaWestern EuropeYemenZaireZimbabweAzores
Immigrants from Trinidad and Tobago
Race
Ancestry
AfghanAfricanAlaska NativeAlaskan AthabascanAlbanianAleutAlsatianAmericanApacheArabArapahoArgentineanArmenianAssyrian/Chaldean/SyriacAustralianAustrianBahamianBangladeshiBarbadianBasqueBelgianBelizeanBermudanBhutaneseBlackfeetBolivianBrazilianBritishBritish West IndianBulgarianBurmeseCajunCambodianCanadianCape VerdeanCarpatho RusynCelticCentral AmericanCentral American IndianCherokeeCheyenneChickasawChileanChineseChippewaChoctawColombianColvilleComancheCosta RicanCreeCreekCroatianCrowCubanCypriotCzechCzechoslovakianDanishDelawareDominicanDutchDutch West IndianEastern EuropeanEcuadorianEgyptianEnglishEstonianEthiopianEuropeanFijianFilipinoFinnishFrenchFrench American IndianFrench CanadianGermanGerman RussianGhanaianGreekGuamanian/ChamorroGuatemalanGuyaneseHaitianHmongHonduranHopiHoumaHungarianIcelanderIndian (Asian)IndonesianInupiatIranianIraqiIrishIroquoisIsraeliItalianJamaicanJapaneseJordanianKenyanKiowaKoreanLaotianLatvianLebaneseLiberianLithuanianLumbeeLuxembourgerMacedonianMalaysianMalteseMarshalleseMenomineeMexicanMexican American IndianMongolianMoroccanNative HawaiianNavajoNepaleseNew ZealanderNicaraguanNigerianNorthern EuropeanNorwegianOkinawanOsageOttawaPaiutePakistaniPalestinianPanamanianParaguayanPennsylvania GermanPeruvianPimaPolishPortuguesePotawatomiPuebloPuerto RicanPuget Sound SalishRomanianRussianSalvadoranSamoanScandinavianScotch-IrishScottishSeminoleSenegaleseSerbianShoshoneSierra LeoneanSiouxSlavicSlovakSloveneSomaliSouth AfricanSouth AmericanSouth American IndianSoviet UnionSpaniardSpanishSpanish AmericanSpanish American IndianSri LankanSubsaharan AfricanSudaneseSwedishSwissSyrianTaiwaneseThaiTlingit-HaidaTohono O'OdhamTonganTrinidadian and TobagonianTsimshianTurkishU.S. Virgin IslanderUgandanUkrainianUruguayanUteVenezuelanVietnameseWelshWest IndianYakamaYaquiYugoslavianYumanYup'ikZimbabwean
Immigration
NonimmigrantsImmigrantsAfghanistanAfricaAlbaniaArmeniaAsiaAustraliaAustriaBahamasBangladeshBarbadosBelarusBelgiumBelizeBoliviaBosnia and HerzegovinaBrazilBulgariaBurma/MyanmarCabo VerdeCambodiaCameroonCanadaCaribbeanCentral AmericaChileChinaColombiaCongoCosta RicaCroatiaCubaCzechoslovakiaDenmarkDominicaDominican RepublicEastern AfricaEastern AsiaEastern EuropeEcuadorEgyptEl SalvadorEnglandEritreaEthiopiaEuropeFijiFranceGermanyGhanaGreeceGrenadaGuatemalaGuyanaHaitiHondurasHong KongHungaryIndiaIndonesiaIranIraqIrelandIsraelItalyJamaicaJapanJordanKazakhstanKenyaKoreaKuwaitLaosLatin AmericaLatviaLebanonLiberiaLithuaniaMalaysiaMexicoMicronesiaMiddle AfricaMoldovaMoroccoNepalNetherlandsNicaraguaNigeriaNorth AmericaNorth MacedoniaNorthern AfricaNorthern EuropeNorwayOceaniaPakistanPanamaPeruPhilippinesPolandPortugalRomaniaRussiaSaudi ArabiaScotlandSenegalSerbiaSierra LeoneSingaporeSomaliaSouth AfricaSouth AmericaSouth Central AsiaSouth Eastern AsiaSouthern EuropeSpainSri LankaSt. Vincent and the GrenadinesSudanSwedenSwitzerlandSyriaTaiwanThailandTrinidad and TobagoTurkeyUgandaUkraineUruguayUzbekistanVenezuelaVietnamWest IndiesWestern AfricaWestern AsiaWestern EuropeYemenZaireZimbabweAzores
Single Father Poverty
Income
Poverty
Unemployment
Labor Participation
Family Structure
Vehicle Availability
Education Level
Disability

Single Father Poverty Comparison

Immigrants from Argentina

Immigrants from Trinidad and Tobago

Exceptional
Tragic
15.8%
SINGLE FATHER POVERTY
92.8/ 100
METRIC RATING
116th/ 347
METRIC RANK
16.8%
SINGLE FATHER POVERTY
4.5/ 100
METRIC RATING
230th/ 347
METRIC RANK

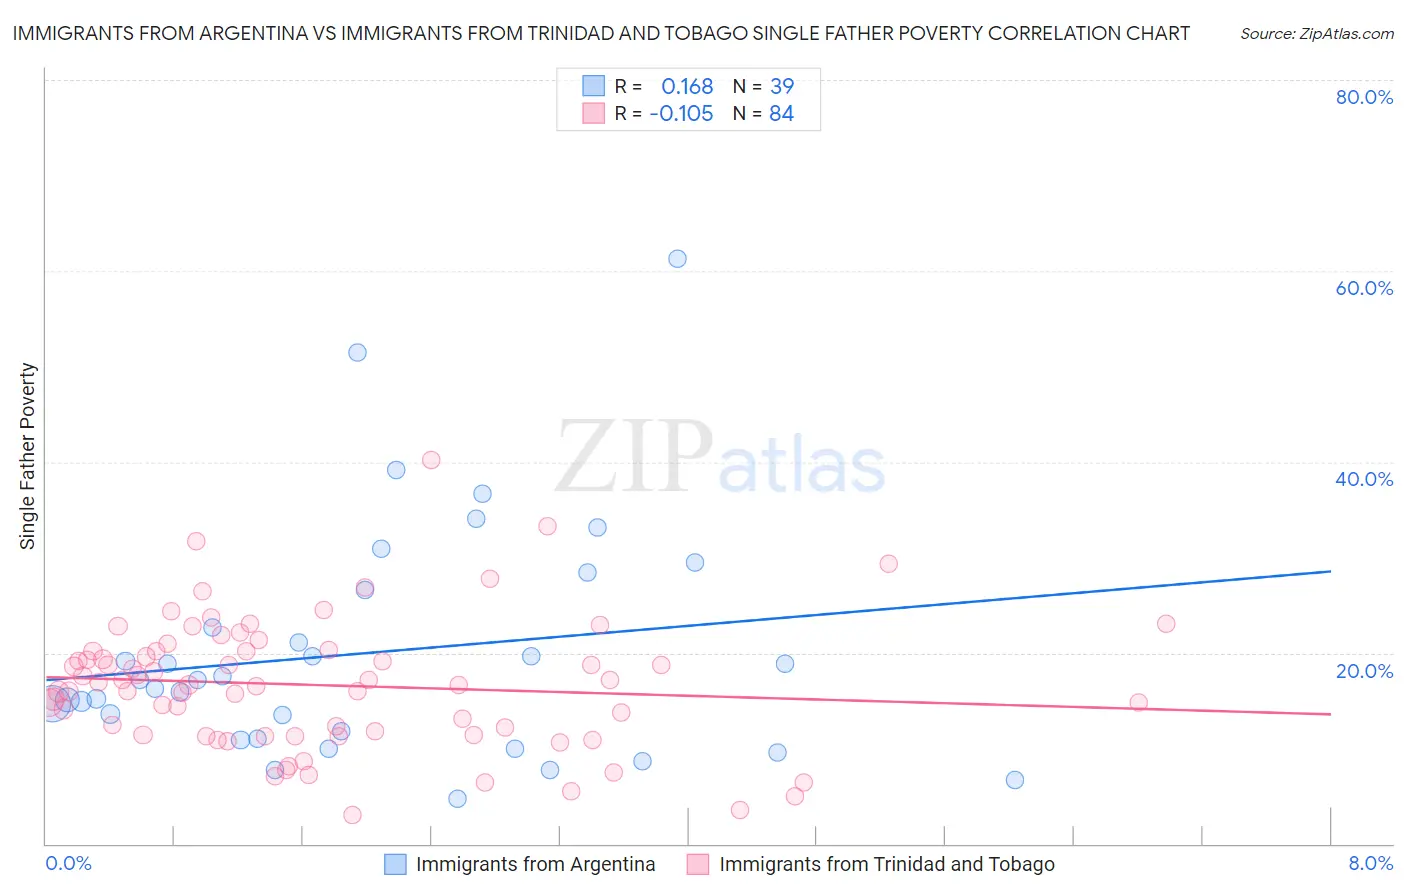
Immigrants from Argentina vs Immigrants from Trinidad and Tobago Single Father Poverty Correlation Chart

The statistical analysis conducted on geographies consisting of 216,888,170 people shows a poor positive correlation between the proportion of Immigrants from Argentina and poverty level among single fathers in the United States with a correlation coefficient (R) of 0.168 and weighted average of 15.8%. Similarly, the statistical analysis conducted on geographies consisting of 189,683,787 people shows a poor negative correlation between the proportion of Immigrants from Trinidad and Tobago and poverty level among single fathers in the United States with a correlation coefficient (R) of -0.105 and weighted average of 16.8%, a difference of 6.4%.
Immigrants from Argentina vs Immigrants from Trinidad and Tobago Single Father Poverty

Single Father Poverty Correlation Summary

MeasurementImmigrants from ArgentinaImmigrants from Trinidad and Tobago
Minimum4.7%3.0%
Maximum61.3%40.2%
Range56.6%37.3%
Mean20.0%16.6%
Median17.1%16.7%
Interquartile 25% (IQ1)11.0%11.4%
Interquartile 75% (IQ3)26.6%20.2%
Interquartile Range (IQR)15.6%8.9%
Standard Deviation (Sample)12.2%6.8%
Standard Deviation (Population)12.1%6.8%

Similar Demographics by Single Father Poverty

Demographics Similar to Immigrants from Argentina by Single Father Poverty

In terms of single father poverty, the demographic groups most similar to Immigrants from Argentina are Immigrants from Colombia (15.8%, a difference of 0.030%), Immigrants from Eastern Europe (15.8%, a difference of 0.040%), Immigrants from Belarus (15.8%, a difference of 0.050%), Uruguayan (15.9%, a difference of 0.11%), and Immigrants (15.9%, a difference of 0.13%).
DemographicsRating | RankSingle Father Poverty
Turks
95.1
/100
|
#109
Exceptional
15.8%
Immigrants | Africa
95.1
/100
|
#110
Exceptional
15.8%
Bulgarians
94.8
/100
|
#111
Exceptional
15.8%
Immigrants | Latvia
94.7
/100
|
#112
Exceptional
15.8%
Danes
94.5
/100
|
#113
Exceptional
15.8%
Argentineans
94.4
/100
|
#114
Exceptional
15.8%
Immigrants | Thailand
93.6
/100
|
#115
Exceptional
15.8%
Immigrants | Argentina
92.8
/100
|
#116
Exceptional
15.8%
Immigrants | Colombia
92.6
/100
|
#117
Exceptional
15.8%
Immigrants | Eastern Europe
92.5
/100
|
#118
Exceptional
15.8%
Immigrants | Belarus
92.4
/100
|
#119
Exceptional
15.8%
Uruguayans
92.1
/100
|
#120
Exceptional
15.9%
Immigrants | Immigrants
91.9
/100
|
#121
Exceptional
15.9%
Sudanese
91.6
/100
|
#122
Exceptional
15.9%
Palestinians
91.3
/100
|
#123
Exceptional
15.9%

Demographics Similar to Immigrants from Trinidad and Tobago by Single Father Poverty

In terms of single father poverty, the demographic groups most similar to Immigrants from Trinidad and Tobago are Israeli (16.8%, a difference of 0.030%), Belgian (16.8%, a difference of 0.19%), Spanish American (16.9%, a difference of 0.21%), Immigrants from Grenada (16.9%, a difference of 0.23%), and British (16.8%, a difference of 0.26%).
DemographicsRating | RankSingle Father Poverty
Immigrants | Austria
7.0
/100
|
#223
Tragic
16.8%
Immigrants | Norway
6.5
/100
|
#224
Tragic
16.8%
Menominee
6.4
/100
|
#225
Tragic
16.8%
Hispanics or Latinos
6.1
/100
|
#226
Tragic
16.8%
British
5.6
/100
|
#227
Tragic
16.8%
Belgians
5.3
/100
|
#228
Tragic
16.8%
Israelis
4.6
/100
|
#229
Tragic
16.8%
Immigrants | Trinidad and Tobago
4.5
/100
|
#230
Tragic
16.8%
Spanish Americans
3.7
/100
|
#231
Tragic
16.9%
Immigrants | Grenada
3.7
/100
|
#232
Tragic
16.9%
Senegalese
3.2
/100
|
#233
Tragic
16.9%
Marshallese
3.1
/100
|
#234
Tragic
16.9%
Immigrants | Western Europe
2.9
/100
|
#235
Tragic
16.9%
Immigrants | Germany
2.9
/100
|
#236
Tragic
16.9%
Sub-Saharan Africans
2.9
/100
|
#237
Tragic
16.9%