Immigrants from Afghanistan vs Immigrants from Chile Child Poverty Under the Age of 16

COMPARE

Immigrants from Afghanistan
Race
Ancestry
AfghanAfricanAlaska NativeAlaskan AthabascanAlbanianAleutAlsatianAmericanApacheArabArapahoArgentineanArmenianAssyrian/Chaldean/SyriacAustralianAustrianBahamianBangladeshiBarbadianBasqueBelgianBelizeanBermudanBhutaneseBlackfeetBolivianBrazilianBritishBritish West IndianBulgarianBurmeseCajunCambodianCanadianCape VerdeanCarpatho RusynCelticCentral AmericanCentral American IndianCherokeeCheyenneChickasawChileanChineseChippewaChoctawColombianColvilleComancheCosta RicanCreeCreekCroatianCrowCubanCypriotCzechCzechoslovakianDanishDelawareDominicanDutchDutch West IndianEastern EuropeanEcuadorianEgyptianEnglishEstonianEthiopianEuropeanFijianFilipinoFinnishFrenchFrench American IndianFrench CanadianGermanGerman RussianGhanaianGreekGuamanian/ChamorroGuatemalanGuyaneseHaitianHmongHonduranHopiHoumaHungarianIcelanderIndian (Asian)IndonesianInupiatIranianIraqiIrishIroquoisIsraeliItalianJamaicanJapaneseJordanianKenyanKiowaKoreanLaotianLatvianLebaneseLiberianLithuanianLumbeeLuxembourgerMacedonianMalaysianMalteseMarshalleseMenomineeMexicanMexican American IndianMongolianMoroccanNative HawaiianNavajoNepaleseNew ZealanderNicaraguanNigerianNorthern EuropeanNorwegianOkinawanOsageOttawaPaiutePakistaniPalestinianPanamanianParaguayanPennsylvania GermanPeruvianPimaPolishPortuguesePotawatomiPuebloPuerto RicanPuget Sound SalishRomanianRussianSalvadoranSamoanScandinavianScotch-IrishScottishSeminoleSenegaleseSerbianShoshoneSierra LeoneanSiouxSlavicSlovakSloveneSomaliSouth AfricanSouth AmericanSouth American IndianSoviet UnionSpaniardSpanishSpanish AmericanSpanish American IndianSri LankanSubsaharan AfricanSudaneseSwedishSwissSyrianTaiwaneseThaiTlingit-HaidaTohono O'OdhamTonganTrinidadian and TobagonianTsimshianTurkishU.S. Virgin IslanderUgandanUkrainianUruguayanUteVenezuelanVietnameseWelshWest IndianYakamaYaquiYugoslavianYumanYup'ikZimbabwean
Immigration
NonimmigrantsImmigrantsAfghanistanAfricaAlbaniaArgentinaArmeniaAsiaAustraliaAustriaBahamasBangladeshBarbadosBelarusBelgiumBelizeBoliviaBosnia and HerzegovinaBrazilBulgariaBurma/MyanmarCabo VerdeCambodiaCameroonCanadaCaribbeanCentral AmericaChinaColombiaCongoCosta RicaCroatiaCubaCzechoslovakiaDenmarkDominicaDominican RepublicEastern AfricaEastern AsiaEastern EuropeEcuadorEgyptEl SalvadorEnglandEritreaEthiopiaEuropeFijiFranceGermanyGhanaGreeceGrenadaGuatemalaGuyanaHaitiHondurasHong KongHungaryIndiaIndonesiaIranIraqIrelandIsraelItalyJamaicaJapanJordanKazakhstanKenyaKoreaKuwaitLaosLatin AmericaLatviaLebanonLiberiaLithuaniaMalaysiaMexicoMicronesiaMiddle AfricaMoldovaMoroccoNepalNetherlandsNicaraguaNigeriaNorth AmericaNorth MacedoniaNorthern AfricaNorthern EuropeNorwayOceaniaPakistanPanamaPeruPhilippinesPolandPortugalRomaniaRussiaSaudi ArabiaScotlandSenegalSerbiaSierra LeoneSingaporeSomaliaSouth AfricaSouth AmericaSouth Central AsiaSouth Eastern AsiaSouthern EuropeSpainSri LankaSt. Vincent and the GrenadinesSudanSwedenSwitzerlandSyriaTaiwanThailandTrinidad and TobagoTurkeyUgandaUkraineUruguayUzbekistanVenezuelaVietnamWest IndiesWestern AfricaWestern AsiaWestern EuropeYemenZaireZimbabweAzores
Immigrants from Chile
Race
Ancestry
AfghanAfricanAlaska NativeAlaskan AthabascanAlbanianAleutAlsatianAmericanApacheArabArapahoArgentineanArmenianAssyrian/Chaldean/SyriacAustralianAustrianBahamianBangladeshiBarbadianBasqueBelgianBelizeanBermudanBhutaneseBlackfeetBolivianBrazilianBritishBritish West IndianBulgarianBurmeseCajunCambodianCanadianCape VerdeanCarpatho RusynCelticCentral AmericanCentral American IndianCherokeeCheyenneChickasawChileanChineseChippewaChoctawColombianColvilleComancheCosta RicanCreeCreekCroatianCrowCubanCypriotCzechCzechoslovakianDanishDelawareDominicanDutchDutch West IndianEastern EuropeanEcuadorianEgyptianEnglishEstonianEthiopianEuropeanFijianFilipinoFinnishFrenchFrench American IndianFrench CanadianGermanGerman RussianGhanaianGreekGuamanian/ChamorroGuatemalanGuyaneseHaitianHmongHonduranHopiHoumaHungarianIcelanderIndian (Asian)IndonesianInupiatIranianIraqiIrishIroquoisIsraeliItalianJamaicanJapaneseJordanianKenyanKiowaKoreanLaotianLatvianLebaneseLiberianLithuanianLumbeeLuxembourgerMacedonianMalaysianMalteseMarshalleseMenomineeMexicanMexican American IndianMongolianMoroccanNative HawaiianNavajoNepaleseNew ZealanderNicaraguanNigerianNorthern EuropeanNorwegianOkinawanOsageOttawaPaiutePakistaniPalestinianPanamanianParaguayanPennsylvania GermanPeruvianPimaPolishPortuguesePotawatomiPuebloPuerto RicanPuget Sound SalishRomanianRussianSalvadoranSamoanScandinavianScotch-IrishScottishSeminoleSenegaleseSerbianShoshoneSierra LeoneanSiouxSlavicSlovakSloveneSomaliSouth AfricanSouth AmericanSouth American IndianSoviet UnionSpaniardSpanishSpanish AmericanSpanish American IndianSri LankanSubsaharan AfricanSudaneseSwedishSwissSyrianTaiwaneseThaiTlingit-HaidaTohono O'OdhamTonganTrinidadian and TobagonianTsimshianTurkishU.S. Virgin IslanderUgandanUkrainianUruguayanUteVenezuelanVietnameseWelshWest IndianYakamaYaquiYugoslavianYumanYup'ikZimbabwean
Immigration
NonimmigrantsImmigrantsAfricaAlbaniaArgentinaArmeniaAsiaAustraliaAustriaBahamasBangladeshBarbadosBelarusBelgiumBelizeBoliviaBosnia and HerzegovinaBrazilBulgariaBurma/MyanmarCabo VerdeCambodiaCameroonCanadaCaribbeanCentral AmericaChileChinaColombiaCongoCosta RicaCroatiaCubaCzechoslovakiaDenmarkDominicaDominican RepublicEastern AfricaEastern AsiaEastern EuropeEcuadorEgyptEl SalvadorEnglandEritreaEthiopiaEuropeFijiFranceGermanyGhanaGreeceGrenadaGuatemalaGuyanaHaitiHondurasHong KongHungaryIndiaIndonesiaIranIraqIrelandIsraelItalyJamaicaJapanJordanKazakhstanKenyaKoreaKuwaitLaosLatin AmericaLatviaLebanonLiberiaLithuaniaMalaysiaMexicoMicronesiaMiddle AfricaMoldovaMoroccoNepalNetherlandsNicaraguaNigeriaNorth AmericaNorth MacedoniaNorthern AfricaNorthern EuropeNorwayOceaniaPakistanPanamaPeruPhilippinesPolandPortugalRomaniaRussiaSaudi ArabiaScotlandSenegalSerbiaSierra LeoneSingaporeSomaliaSouth AfricaSouth AmericaSouth Central AsiaSouth Eastern AsiaSouthern EuropeSpainSri LankaSt. Vincent and the GrenadinesSudanSwedenSwitzerlandSyriaTaiwanThailandTrinidad and TobagoTurkeyUgandaUkraineUruguayUzbekistanVenezuelaVietnamWest IndiesWestern AfricaWestern AsiaWestern EuropeYemenZaireZimbabweAzores
Child Poverty Under the Age of 16
Income
Poverty
Unemployment
Labor Participation
Family Structure
Vehicle Availability
Education Level
Disability

Child Poverty Under the Age of 16 Comparison

Immigrants from Afghanistan

Immigrants from Chile

Poor
Good
17.0%
CHILD POVERTY UNDER THE AGE OF 16
15.1/ 100
METRIC RATING
199th/ 347
METRIC RANK
15.7%
CHILD POVERTY UNDER THE AGE OF 16
72.8/ 100
METRIC RATING
158th/ 347
METRIC RANK

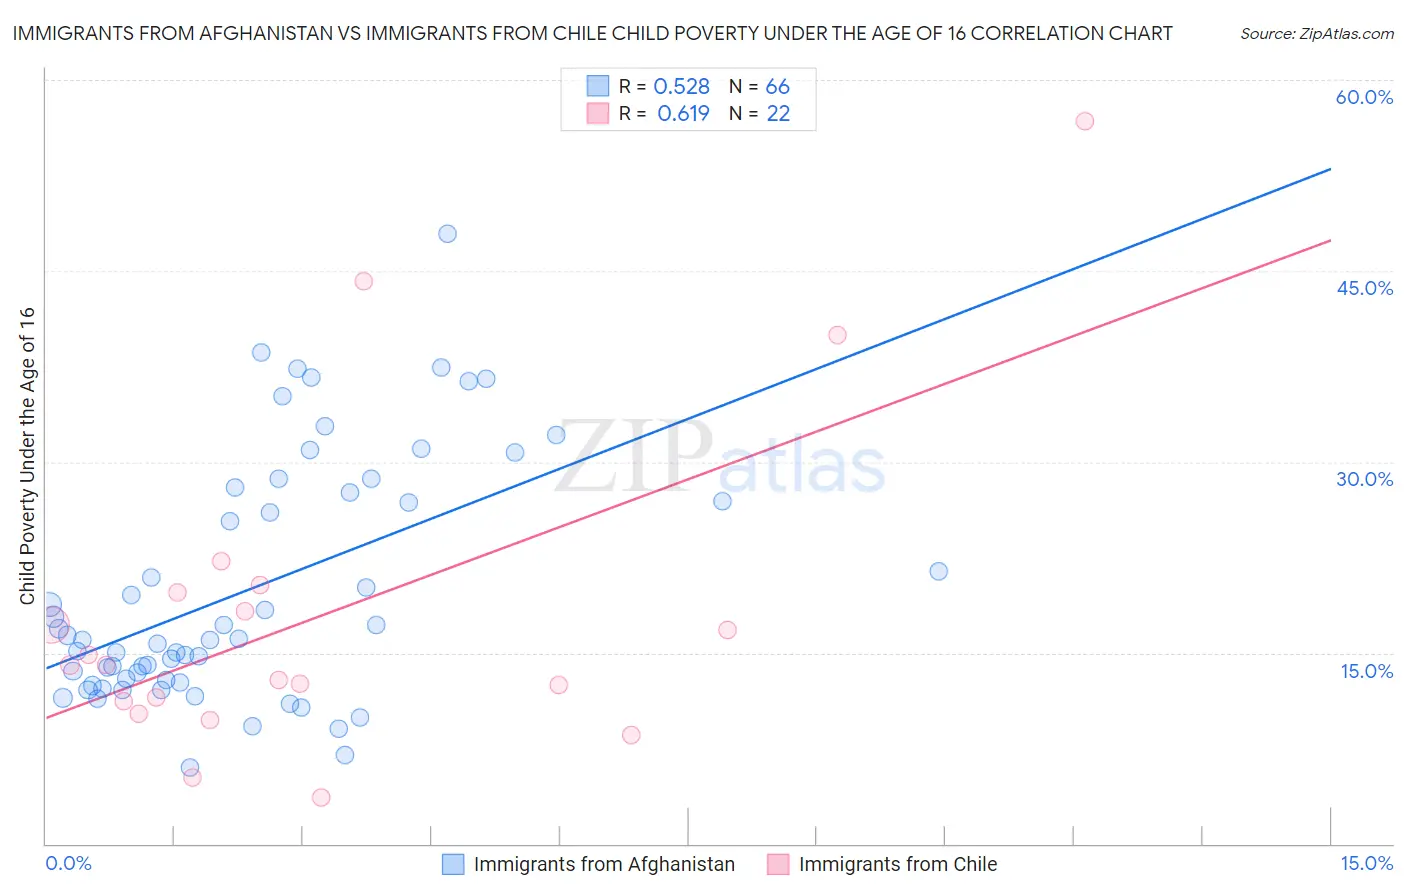
Immigrants from Afghanistan vs Immigrants from Chile Child Poverty Under the Age of 16 Correlation Chart

The statistical analysis conducted on geographies consisting of 147,262,945 people shows a substantial positive correlation between the proportion of Immigrants from Afghanistan and poverty level among children under the age of 16 in the United States with a correlation coefficient (R) of 0.528 and weighted average of 17.0%. Similarly, the statistical analysis conducted on geographies consisting of 217,865,801 people shows a significant positive correlation between the proportion of Immigrants from Chile and poverty level among children under the age of 16 in the United States with a correlation coefficient (R) of 0.619 and weighted average of 15.7%, a difference of 8.4%.
Immigrants from Afghanistan vs Immigrants from Chile Child Poverty Under the Age of 16

Child Poverty Under the Age of 16 Correlation Summary

MeasurementImmigrants from AfghanistanImmigrants from Chile
Minimum6.0%3.6%
Maximum48.0%56.8%
Range42.0%53.2%
Mean20.0%18.0%
Median16.0%14.0%
Interquartile 25% (IQ1)12.9%11.2%
Interquartile 75% (IQ3)27.6%19.8%
Interquartile Range (IQR)14.7%8.6%
Standard Deviation (Sample)9.6%12.9%
Standard Deviation (Population)9.5%12.6%

Similar Demographics by Child Poverty Under the Age of 16

Demographics Similar to Immigrants from Afghanistan by Child Poverty Under the Age of 16

In terms of child poverty under the age of 16, the demographic groups most similar to Immigrants from Afghanistan are Immigrants from Cameroon (17.1%, a difference of 0.10%), Immigrants from Uzbekistan (17.1%, a difference of 0.11%), Ugandan (17.1%, a difference of 0.19%), Immigrants from Sierra Leone (17.1%, a difference of 0.21%), and Hmong (17.1%, a difference of 0.27%).
DemographicsRating | RankChild Poverty Under the Age of 16
Spanish
24.5
/100
|
#192
Fair
16.7%
Spaniards
23.2
/100
|
#193
Fair
16.8%
Immigrants | Uruguay
23.1
/100
|
#194
Fair
16.8%
Immigrants | Uganda
22.5
/100
|
#195
Fair
16.8%
Immigrants | Lebanon
22.0
/100
|
#196
Fair
16.8%
Immigrants | Kenya
19.1
/100
|
#197
Poor
16.9%
Delaware
17.1
/100
|
#198
Poor
17.0%
Immigrants | Afghanistan
15.1
/100
|
#199
Poor
17.0%
Immigrants | Cameroon
14.7
/100
|
#200
Poor
17.1%
Immigrants | Uzbekistan
14.7
/100
|
#201
Poor
17.1%
Ugandans
14.3
/100
|
#202
Poor
17.1%
Immigrants | Sierra Leone
14.2
/100
|
#203
Poor
17.1%
Hmong
14.0
/100
|
#204
Poor
17.1%
Aleuts
13.9
/100
|
#205
Poor
17.1%
Alaska Natives
11.8
/100
|
#206
Poor
17.2%

Demographics Similar to Immigrants from Chile by Child Poverty Under the Age of 16

In terms of child poverty under the age of 16, the demographic groups most similar to Immigrants from Chile are Immigrants from Nepal (15.7%, a difference of 0.020%), Immigrants from Fiji (15.8%, a difference of 0.26%), Immigrants from Albania (15.8%, a difference of 0.32%), Immigrants from Venezuela (15.7%, a difference of 0.33%), and Syrian (15.6%, a difference of 0.53%).
DemographicsRating | RankChild Poverty Under the Age of 16
French
78.5
/100
|
#151
Good
15.6%
French Canadians
78.2
/100
|
#152
Good
15.6%
Venezuelans
77.4
/100
|
#153
Good
15.6%
Samoans
77.3
/100
|
#154
Good
15.6%
Syrians
76.1
/100
|
#155
Good
15.6%
Immigrants | Venezuela
74.9
/100
|
#156
Good
15.7%
Immigrants | Nepal
72.9
/100
|
#157
Good
15.7%
Immigrants | Chile
72.8
/100
|
#158
Good
15.7%
Immigrants | Fiji
71.1
/100
|
#159
Good
15.8%
Immigrants | Albania
70.7
/100
|
#160
Good
15.8%
Immigrants | Northern Africa
68.1
/100
|
#161
Good
15.8%
Colombians
67.6
/100
|
#162
Good
15.8%
Yugoslavians
67.6
/100
|
#163
Good
15.8%
Immigrants | Germany
67.3
/100
|
#164
Good
15.8%
Guamanians/Chamorros
66.4
/100
|
#165
Good
15.9%