Immigrants from Afghanistan vs Cuban Seniors Poverty Over the Age of 75

COMPARE

Immigrants from Afghanistan
Race
Ancestry
AfghanAfricanAlaska NativeAlaskan AthabascanAlbanianAleutAlsatianAmericanApacheArabArapahoArgentineanArmenianAssyrian/Chaldean/SyriacAustralianAustrianBahamianBangladeshiBarbadianBasqueBelgianBelizeanBermudanBhutaneseBlackfeetBolivianBrazilianBritishBritish West IndianBulgarianBurmeseCajunCambodianCanadianCape VerdeanCarpatho RusynCelticCentral AmericanCentral American IndianCherokeeCheyenneChickasawChileanChineseChippewaChoctawColombianColvilleComancheCosta RicanCreeCreekCroatianCrowCypriotCzechCzechoslovakianDanishDelawareDominicanDutchDutch West IndianEastern EuropeanEcuadorianEgyptianEnglishEstonianEthiopianEuropeanFijianFilipinoFinnishFrenchFrench American IndianFrench CanadianGermanGerman RussianGhanaianGreekGuamanian/ChamorroGuatemalanGuyaneseHaitianHmongHonduranHopiHoumaHungarianIcelanderIndian (Asian)IndonesianInupiatIranianIraqiIrishIroquoisIsraeliItalianJamaicanJapaneseJordanianKenyanKiowaKoreanLaotianLatvianLebaneseLiberianLithuanianLumbeeLuxembourgerMacedonianMalaysianMalteseMarshalleseMenomineeMexicanMexican American IndianMongolianMoroccanNative HawaiianNavajoNepaleseNew ZealanderNicaraguanNigerianNorthern EuropeanNorwegianOkinawanOsageOttawaPaiutePakistaniPalestinianPanamanianParaguayanPennsylvania GermanPeruvianPimaPolishPortuguesePotawatomiPuebloPuerto RicanPuget Sound SalishRomanianRussianSalvadoranSamoanScandinavianScotch-IrishScottishSeminoleSenegaleseSerbianShoshoneSierra LeoneanSiouxSlavicSlovakSloveneSomaliSouth AfricanSouth AmericanSouth American IndianSoviet UnionSpaniardSpanishSpanish AmericanSpanish American IndianSri LankanSubsaharan AfricanSudaneseSwedishSwissSyrianTaiwaneseThaiTlingit-HaidaTohono O'OdhamTonganTrinidadian and TobagonianTsimshianTurkishU.S. Virgin IslanderUgandanUkrainianUruguayanUteVenezuelanVietnameseWelshWest IndianYakamaYaquiYugoslavianYumanYup'ikZimbabwean
Immigration
NonimmigrantsImmigrantsAfghanistanAfricaAlbaniaArgentinaArmeniaAsiaAustraliaAustriaBahamasBangladeshBarbadosBelarusBelgiumBelizeBoliviaBosnia and HerzegovinaBrazilBulgariaBurma/MyanmarCabo VerdeCambodiaCameroonCanadaCaribbeanCentral AmericaChileChinaColombiaCongoCosta RicaCroatiaCubaCzechoslovakiaDenmarkDominicaDominican RepublicEastern AfricaEastern AsiaEastern EuropeEcuadorEgyptEl SalvadorEnglandEritreaEthiopiaEuropeFijiFranceGermanyGhanaGreeceGrenadaGuatemalaGuyanaHaitiHondurasHong KongHungaryIndiaIndonesiaIranIraqIrelandIsraelItalyJamaicaJapanJordanKazakhstanKenyaKoreaKuwaitLaosLatin AmericaLatviaLebanonLiberiaLithuaniaMalaysiaMexicoMicronesiaMiddle AfricaMoldovaMoroccoNepalNetherlandsNicaraguaNigeriaNorth AmericaNorth MacedoniaNorthern AfricaNorthern EuropeNorwayOceaniaPakistanPanamaPeruPhilippinesPolandPortugalRomaniaRussiaSaudi ArabiaScotlandSenegalSerbiaSierra LeoneSingaporeSomaliaSouth AfricaSouth AmericaSouth Central AsiaSouth Eastern AsiaSouthern EuropeSpainSri LankaSt. Vincent and the GrenadinesSudanSwedenSwitzerlandSyriaTaiwanThailandTrinidad and TobagoTurkeyUgandaUkraineUruguayUzbekistanVenezuelaVietnamWest IndiesWestern AfricaWestern AsiaWestern EuropeYemenZaireZimbabweAzores
Cuban
Race
Ancestry
AfghanAfricanAlaska NativeAlaskan AthabascanAlbanianAleutAlsatianAmericanApacheArabArapahoArgentineanArmenianAssyrian/Chaldean/SyriacAustralianAustrianBahamianBangladeshiBarbadianBasqueBelgianBelizeanBermudanBhutaneseBlackfeetBolivianBrazilianBritishBritish West IndianBulgarianBurmeseCajunCambodianCanadianCape VerdeanCarpatho RusynCelticCentral AmericanCentral American IndianCherokeeCheyenneChickasawChileanChineseChippewaChoctawColombianColvilleComancheCosta RicanCreeCreekCroatianCrowCubanCypriotCzechCzechoslovakianDanishDelawareDominicanDutchDutch West IndianEastern EuropeanEcuadorianEgyptianEnglishEstonianEthiopianEuropeanFijianFilipinoFinnishFrenchFrench American IndianFrench CanadianGermanGerman RussianGhanaianGreekGuamanian/ChamorroGuatemalanGuyaneseHaitianHmongHonduranHopiHoumaHungarianIcelanderIndian (Asian)IndonesianInupiatIranianIraqiIrishIroquoisIsraeliItalianJamaicanJapaneseJordanianKenyanKiowaKoreanLaotianLatvianLebaneseLiberianLithuanianLumbeeLuxembourgerMacedonianMalaysianMalteseMarshalleseMenomineeMexicanMexican American IndianMongolianMoroccanNative HawaiianNavajoNepaleseNew ZealanderNicaraguanNigerianNorthern EuropeanNorwegianOkinawanOsageOttawaPaiutePakistaniPalestinianPanamanianParaguayanPennsylvania GermanPeruvianPimaPolishPortuguesePotawatomiPuebloPuerto RicanPuget Sound SalishRomanianRussianSalvadoranSamoanScandinavianScotch-IrishScottishSeminoleSenegaleseSerbianShoshoneSierra LeoneanSiouxSlavicSlovakSloveneSomaliSouth AfricanSouth AmericanSouth American IndianSoviet UnionSpaniardSpanishSpanish AmericanSpanish American IndianSri LankanSubsaharan AfricanSudaneseSwedishSwissSyrianTaiwaneseThaiTlingit-HaidaTohono O'OdhamTonganTrinidadian and TobagonianTsimshianTurkishU.S. Virgin IslanderUgandanUkrainianUruguayanUteVenezuelanVietnameseWelshWest IndianYakamaYaquiYugoslavianYumanYup'ikZimbabwean
Immigration
NonimmigrantsImmigrantsAfricaAlbaniaArgentinaArmeniaAsiaAustraliaAustriaBahamasBangladeshBarbadosBelarusBelgiumBelizeBoliviaBosnia and HerzegovinaBrazilBulgariaBurma/MyanmarCabo VerdeCambodiaCameroonCanadaCaribbeanCentral AmericaChileChinaColombiaCongoCosta RicaCroatiaCubaCzechoslovakiaDenmarkDominicaDominican RepublicEastern AfricaEastern AsiaEastern EuropeEcuadorEgyptEl SalvadorEnglandEritreaEthiopiaEuropeFijiFranceGermanyGhanaGreeceGrenadaGuatemalaGuyanaHaitiHondurasHong KongHungaryIndiaIndonesiaIranIraqIrelandIsraelItalyJamaicaJapanJordanKazakhstanKenyaKoreaKuwaitLaosLatin AmericaLatviaLebanonLiberiaLithuaniaMalaysiaMexicoMicronesiaMiddle AfricaMoldovaMoroccoNepalNetherlandsNicaraguaNigeriaNorth AmericaNorth MacedoniaNorthern AfricaNorthern EuropeNorwayOceaniaPakistanPanamaPeruPhilippinesPolandPortugalRomaniaRussiaSaudi ArabiaScotlandSenegalSerbiaSierra LeoneSingaporeSomaliaSouth AfricaSouth AmericaSouth Central AsiaSouth Eastern AsiaSouthern EuropeSpainSri LankaSt. Vincent and the GrenadinesSudanSwedenSwitzerlandSyriaTaiwanThailandTrinidad and TobagoTurkeyUgandaUkraineUruguayUzbekistanVenezuelaVietnamWest IndiesWestern AfricaWestern AsiaWestern EuropeYemenZaireZimbabweAzores
Seniors Poverty Over the Age of 75
Income
Poverty
Unemployment
Labor Participation
Family Structure
Vehicle Availability
Education Level
Disability

Seniors Poverty Over the Age of 75 Comparison

Immigrants from Afghanistan

Cubans

Exceptional
Tragic
11.3%
SENIORS POVERTY OVER THE AGE OF 75
97.5/ 100
METRIC RATING
63rd/ 347
METRIC RANK
18.0%
SENIORS POVERTY OVER THE AGE OF 75
0.0/ 100
METRIC RATING
335th/ 347
METRIC RANK

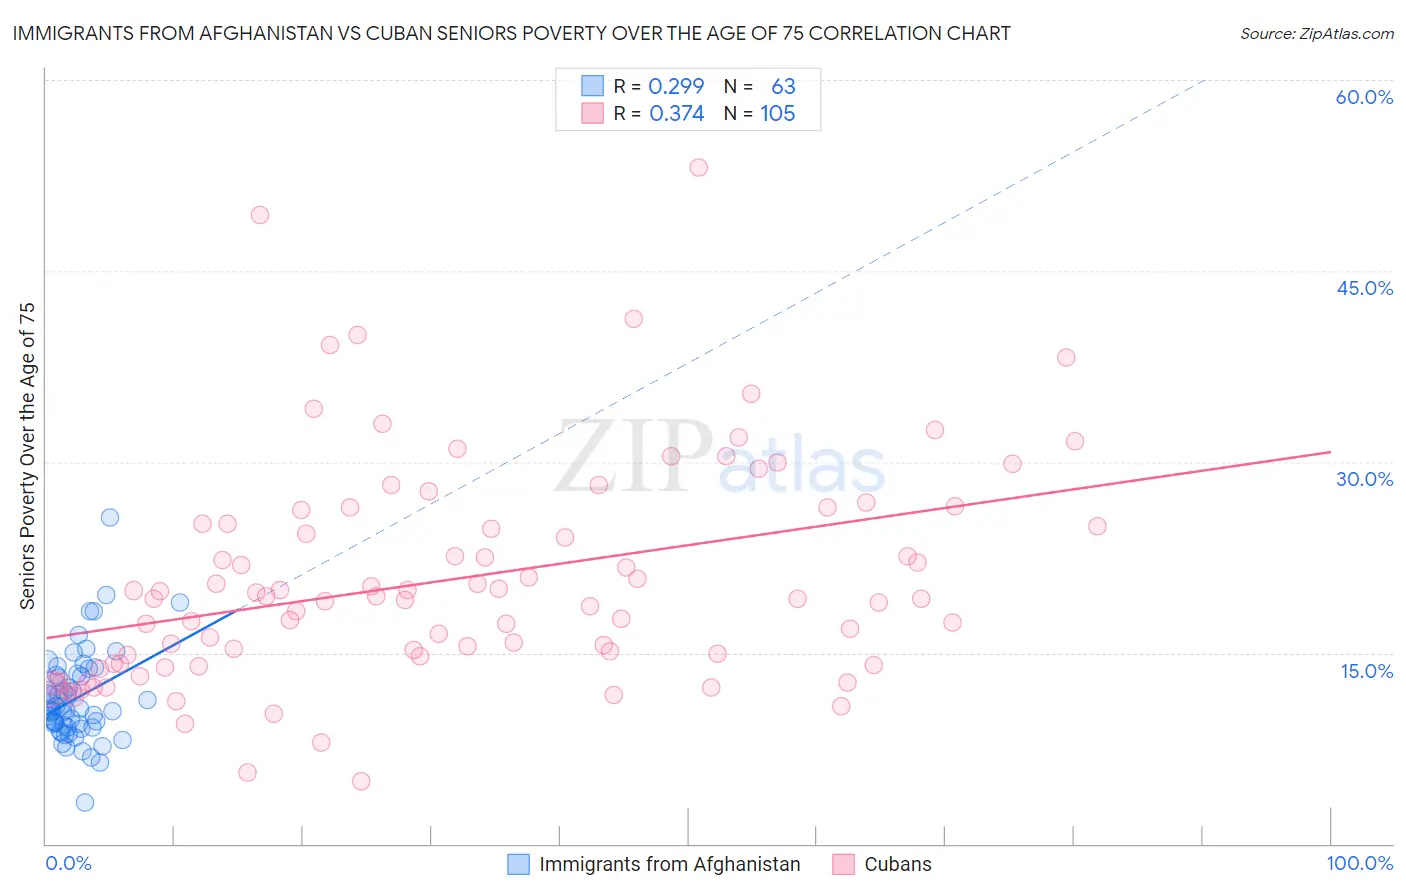
Immigrants from Afghanistan vs Cuban Seniors Poverty Over the Age of 75 Correlation Chart

The statistical analysis conducted on geographies consisting of 147,002,126 people shows a weak positive correlation between the proportion of Immigrants from Afghanistan and poverty level among seniors over the age of 75 in the United States with a correlation coefficient (R) of 0.299 and weighted average of 11.3%. Similarly, the statistical analysis conducted on geographies consisting of 443,347,202 people shows a mild positive correlation between the proportion of Cubans and poverty level among seniors over the age of 75 in the United States with a correlation coefficient (R) of 0.374 and weighted average of 18.0%, a difference of 59.2%.
Immigrants from Afghanistan vs Cuban Seniors Poverty Over the Age of 75

Seniors Poverty Over the Age of 75 Correlation Summary

MeasurementImmigrants from AfghanistanCuban
Minimum3.2%4.9%
Maximum25.6%53.2%
Range22.4%48.3%
Mean11.4%20.8%
Median10.5%19.2%
Interquartile 25% (IQ1)9.2%14.5%
Interquartile 75% (IQ3)13.3%25.7%
Interquartile Range (IQR)4.1%11.2%
Standard Deviation (Sample)3.6%8.7%
Standard Deviation (Population)3.6%8.7%

Similar Demographics by Seniors Poverty Over the Age of 75

Demographics Similar to Immigrants from Afghanistan by Seniors Poverty Over the Age of 75

In terms of seniors poverty over the age of 75, the demographic groups most similar to Immigrants from Afghanistan are Immigrants from North America (11.3%, a difference of 0.040%), Canadian (11.3%, a difference of 0.14%), Immigrants from Northern Europe (11.3%, a difference of 0.14%), Eastern European (11.3%, a difference of 0.17%), and Immigrants from Netherlands (11.2%, a difference of 0.28%).
DemographicsRating | RankSeniors Poverty Over the Age of 75
Slavs
98.1
/100
|
#56
Exceptional
11.2%
Immigrants | Canada
97.9
/100
|
#57
Exceptional
11.2%
Yugoslavians
97.9
/100
|
#58
Exceptional
11.2%
Immigrants | Netherlands
97.8
/100
|
#59
Exceptional
11.2%
Eastern Europeans
97.7
/100
|
#60
Exceptional
11.3%
Canadians
97.7
/100
|
#61
Exceptional
11.3%
Immigrants | North America
97.6
/100
|
#62
Exceptional
11.3%
Immigrants | Afghanistan
97.5
/100
|
#63
Exceptional
11.3%
Immigrants | Northern Europe
97.4
/100
|
#64
Exceptional
11.3%
Immigrants | Taiwan
96.7
/100
|
#65
Exceptional
11.4%
Estonians
96.7
/100
|
#66
Exceptional
11.4%
Bolivians
96.5
/100
|
#67
Exceptional
11.4%
Immigrants | Austria
96.5
/100
|
#68
Exceptional
11.4%
Ottawa
96.5
/100
|
#69
Exceptional
11.4%
Immigrants | South Central Asia
96.4
/100
|
#70
Exceptional
11.4%

Demographics Similar to Cubans by Seniors Poverty Over the Age of 75

In terms of seniors poverty over the age of 75, the demographic groups most similar to Cubans are Immigrants from Grenada (17.8%, a difference of 0.59%), Immigrants from Caribbean (18.2%, a difference of 1.6%), Yakama (18.3%, a difference of 2.1%), Immigrants from Nicaragua (17.6%, a difference of 2.1%), and Immigrants from St. Vincent and the Grenadines (17.5%, a difference of 2.6%).
DemographicsRating | RankSeniors Poverty Over the Age of 75
Cape Verdeans
0.0
/100
|
#328
Tragic
16.8%
Immigrants | Dominica
0.0
/100
|
#329
Tragic
17.0%
British West Indians
0.0
/100
|
#330
Tragic
17.4%
Immigrants | Armenia
0.0
/100
|
#331
Tragic
17.5%
Immigrants | St. Vincent and the Grenadines
0.0
/100
|
#332
Tragic
17.5%
Immigrants | Nicaragua
0.0
/100
|
#333
Tragic
17.6%
Immigrants | Grenada
0.0
/100
|
#334
Tragic
17.8%
Cubans
0.0
/100
|
#335
Tragic
18.0%
Immigrants | Caribbean
0.0
/100
|
#336
Tragic
18.2%
Yakama
0.0
/100
|
#337
Tragic
18.3%
Immigrants | Cabo Verde
0.0
/100
|
#338
Tragic
18.5%
Hopi
0.0
/100
|
#339
Tragic
18.9%
Tohono O'odham
0.0
/100
|
#340
Tragic
19.1%
Navajo
0.0
/100
|
#341
Tragic
19.4%
Dominicans
0.0
/100
|
#342
Tragic
19.6%