Icelander vs Scotch-Irish Female Poverty

COMPARE

Icelander
Race
Ancestry
AfghanAfricanAlaska NativeAlaskan AthabascanAlbanianAleutAlsatianAmericanApacheArabArapahoArgentineanArmenianAssyrian/Chaldean/SyriacAustralianAustrianBahamianBangladeshiBarbadianBasqueBelgianBelizeanBermudanBhutaneseBlackfeetBolivianBrazilianBritishBritish West IndianBulgarianBurmeseCajunCambodianCanadianCape VerdeanCarpatho RusynCelticCentral AmericanCentral American IndianCherokeeCheyenneChickasawChileanChineseChippewaChoctawColombianColvilleComancheCosta RicanCreeCreekCroatianCrowCubanCypriotCzechCzechoslovakianDanishDelawareDominicanDutchDutch West IndianEastern EuropeanEcuadorianEgyptianEnglishEstonianEthiopianEuropeanFijianFilipinoFinnishFrenchFrench American IndianFrench CanadianGermanGerman RussianGhanaianGreekGuamanian/ChamorroGuatemalanGuyaneseHaitianHmongHonduranHopiHoumaHungarianIcelanderIndian (Asian)IndonesianInupiatIranianIraqiIrishIroquoisIsraeliItalianJamaicanJapaneseJordanianKenyanKiowaKoreanLaotianLatvianLebaneseLiberianLithuanianLumbeeLuxembourgerMacedonianMalaysianMalteseMarshalleseMenomineeMexicanMexican American IndianMongolianMoroccanNative HawaiianNavajoNepaleseNew ZealanderNicaraguanNigerianNorthern EuropeanNorwegianOkinawanOsageOttawaPaiutePakistaniPalestinianPanamanianParaguayanPennsylvania GermanPeruvianPimaPolishPortuguesePotawatomiPuebloPuerto RicanPuget Sound SalishRomanianRussianSalvadoranSamoanScandinavianScottishSeminoleSenegaleseSerbianShoshoneSierra LeoneanSiouxSlavicSlovakSloveneSomaliSouth AfricanSouth AmericanSouth American IndianSoviet UnionSpaniardSpanishSpanish AmericanSpanish American IndianSri LankanSubsaharan AfricanSudaneseSwedishSwissSyrianTaiwaneseThaiTlingit-HaidaTohono O'OdhamTonganTrinidadian and TobagonianTsimshianTurkishU.S. Virgin IslanderUgandanUkrainianUruguayanUteVenezuelanVietnameseWelshWest IndianYakamaYaquiYugoslavianYumanYup'ikZimbabwean
Immigration
NonimmigrantsImmigrantsAfghanistanAfricaAlbaniaArgentinaArmeniaAsiaAustraliaAustriaBahamasBangladeshBarbadosBelarusBelgiumBelizeBoliviaBosnia and HerzegovinaBrazilBulgariaBurma/MyanmarCabo VerdeCambodiaCameroonCanadaCaribbeanCentral AmericaChileChinaColombiaCongoCosta RicaCroatiaCubaCzechoslovakiaDenmarkDominicaDominican RepublicEastern AfricaEastern AsiaEastern EuropeEcuadorEgyptEl SalvadorEnglandEritreaEthiopiaEuropeFijiFranceGermanyGhanaGreeceGrenadaGuatemalaGuyanaHaitiHondurasHong KongHungaryIndiaIndonesiaIranIraqIrelandIsraelItalyJamaicaJapanJordanKazakhstanKenyaKoreaKuwaitLaosLatin AmericaLatviaLebanonLiberiaLithuaniaMalaysiaMexicoMicronesiaMiddle AfricaMoldovaMoroccoNepalNetherlandsNicaraguaNigeriaNorth AmericaNorth MacedoniaNorthern AfricaNorthern EuropeNorwayOceaniaPakistanPanamaPeruPhilippinesPolandPortugalRomaniaRussiaSaudi ArabiaScotlandSenegalSerbiaSierra LeoneSingaporeSomaliaSouth AfricaSouth AmericaSouth Central AsiaSouth Eastern AsiaSouthern EuropeSpainSri LankaSt. Vincent and the GrenadinesSudanSwedenSwitzerlandSyriaTaiwanThailandTrinidad and TobagoTurkeyUgandaUkraineUruguayUzbekistanVenezuelaVietnamWest IndiesWestern AfricaWestern AsiaWestern EuropeYemenZaireZimbabweAzores
Scotch-Irish
Race
Ancestry
AfghanAfricanAlaska NativeAlaskan AthabascanAlbanianAleutAlsatianAmericanApacheArabArapahoArgentineanArmenianAssyrian/Chaldean/SyriacAustralianAustrianBahamianBangladeshiBarbadianBasqueBelgianBelizeanBermudanBhutaneseBlackfeetBolivianBrazilianBritishBritish West IndianBulgarianBurmeseCajunCambodianCanadianCape VerdeanCarpatho RusynCelticCentral AmericanCentral American IndianCherokeeCheyenneChickasawChileanChineseChippewaChoctawColombianColvilleComancheCosta RicanCreeCreekCroatianCrowCubanCypriotCzechCzechoslovakianDanishDelawareDominicanDutchDutch West IndianEastern EuropeanEcuadorianEgyptianEnglishEstonianEthiopianEuropeanFijianFilipinoFinnishFrenchFrench American IndianFrench CanadianGermanGerman RussianGhanaianGreekGuamanian/ChamorroGuatemalanGuyaneseHaitianHmongHonduranHopiHoumaHungarianIndian (Asian)IndonesianInupiatIranianIraqiIrishIroquoisIsraeliItalianJamaicanJapaneseJordanianKenyanKiowaKoreanLaotianLatvianLebaneseLiberianLithuanianLumbeeLuxembourgerMacedonianMalaysianMalteseMarshalleseMenomineeMexicanMexican American IndianMongolianMoroccanNative HawaiianNavajoNepaleseNew ZealanderNicaraguanNigerianNorthern EuropeanNorwegianOkinawanOsageOttawaPaiutePakistaniPalestinianPanamanianParaguayanPennsylvania GermanPeruvianPimaPolishPortuguesePotawatomiPuebloPuerto RicanPuget Sound SalishRomanianRussianSalvadoranSamoanScandinavianScotch-IrishScottishSeminoleSenegaleseSerbianShoshoneSierra LeoneanSiouxSlavicSlovakSloveneSomaliSouth AfricanSouth AmericanSouth American IndianSoviet UnionSpaniardSpanishSpanish AmericanSpanish American IndianSri LankanSubsaharan AfricanSudaneseSwedishSwissSyrianTaiwaneseThaiTlingit-HaidaTohono O'OdhamTonganTrinidadian and TobagonianTsimshianTurkishU.S. Virgin IslanderUgandanUkrainianUruguayanUteVenezuelanVietnameseWelshWest IndianYakamaYaquiYugoslavianYumanYup'ikZimbabwean
Immigration
NonimmigrantsImmigrantsAfghanistanAfricaAlbaniaArgentinaArmeniaAsiaAustraliaAustriaBahamasBangladeshBarbadosBelarusBelgiumBelizeBoliviaBosnia and HerzegovinaBrazilBulgariaBurma/MyanmarCabo VerdeCambodiaCameroonCanadaCaribbeanCentral AmericaChileChinaColombiaCongoCosta RicaCroatiaCubaCzechoslovakiaDenmarkDominicaDominican RepublicEastern AfricaEastern AsiaEastern EuropeEcuadorEgyptEl SalvadorEnglandEritreaEthiopiaEuropeFijiFranceGermanyGhanaGreeceGrenadaGuatemalaGuyanaHaitiHondurasHong KongHungaryIndiaIndonesiaIranIraqIrelandIsraelItalyJamaicaJapanJordanKazakhstanKenyaKoreaKuwaitLaosLatin AmericaLatviaLebanonLiberiaLithuaniaMalaysiaMexicoMicronesiaMiddle AfricaMoldovaMoroccoNepalNetherlandsNicaraguaNigeriaNorth AmericaNorth MacedoniaNorthern AfricaNorthern EuropeNorwayOceaniaPakistanPanamaPeruPhilippinesPolandPortugalRomaniaRussiaSaudi ArabiaScotlandSenegalSerbiaSierra LeoneSingaporeSomaliaSouth AfricaSouth AmericaSouth Central AsiaSouth Eastern AsiaSouthern EuropeSpainSri LankaSt. Vincent and the GrenadinesSudanSwedenSwitzerlandSyriaTaiwanThailandTrinidad and TobagoTurkeyUgandaUkraineUruguayUzbekistanVenezuelaVietnamWest IndiesWestern AfricaWestern AsiaWestern EuropeYemenZaireZimbabweAzores
Female Poverty
Income
Poverty
Unemployment
Labor Participation
Family Structure
Vehicle Availability
Education Level
Disability

Female Poverty Comparison

Icelanders

Scotch-Irish

Excellent
Good
13.0%
FEMALE POVERTY
81.1/ 100
METRIC RATING
141st/ 347
METRIC RANK
13.3%
FEMALE POVERTY
62.1/ 100
METRIC RATING
165th/ 347
METRIC RANK

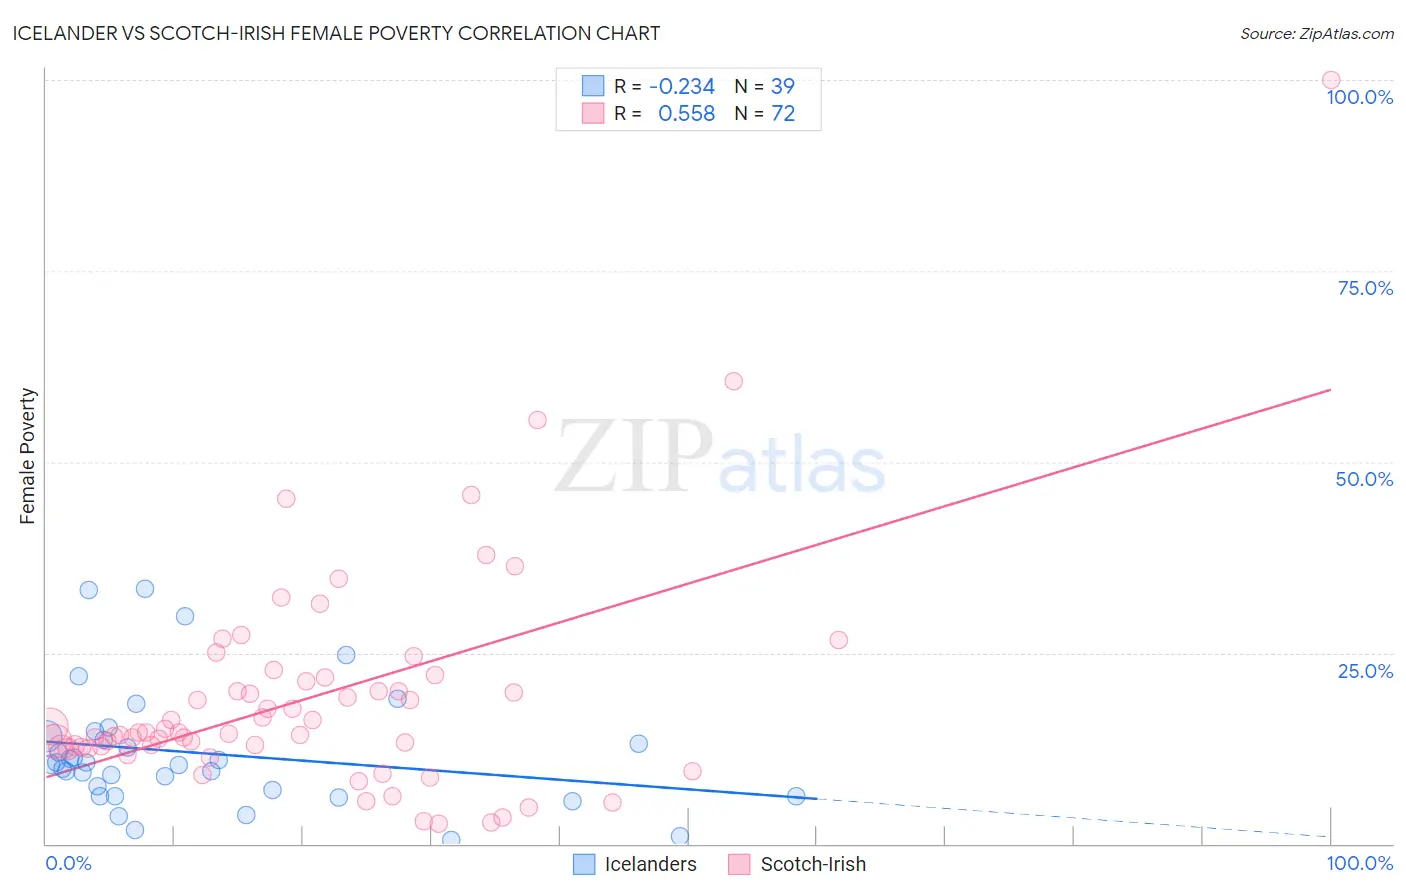
Icelander vs Scotch-Irish Female Poverty Correlation Chart

The statistical analysis conducted on geographies consisting of 159,608,280 people shows a weak negative correlation between the proportion of Icelanders and poverty level among females in the United States with a correlation coefficient (R) of -0.234 and weighted average of 13.0%. Similarly, the statistical analysis conducted on geographies consisting of 547,935,242 people shows a substantial positive correlation between the proportion of Scotch-Irish and poverty level among females in the United States with a correlation coefficient (R) of 0.558 and weighted average of 13.3%, a difference of 2.4%.
Icelander vs Scotch-Irish Female Poverty

Female Poverty Correlation Summary

MeasurementIcelanderScotch-Irish
Minimum0.47%2.6%
Maximum33.3%100.0%
Range32.9%97.4%
Mean11.8%19.2%
Median10.4%14.6%
Interquartile 25% (IQ1)6.2%12.6%
Interquartile 75% (IQ3)14.1%21.5%
Interquartile Range (IQR)7.8%8.8%
Standard Deviation (Sample)7.9%14.9%
Standard Deviation (Population)7.8%14.8%

Similar Demographics by Female Poverty

Demographics Similar to Icelanders by Female Poverty

In terms of female poverty, the demographic groups most similar to Icelanders are Brazilian (13.0%, a difference of 0.10%), Immigrants from Malaysia (13.0%, a difference of 0.12%), Afghan (13.0%, a difference of 0.21%), Syrian (13.0%, a difference of 0.24%), and Immigrants from Peru (13.0%, a difference of 0.31%).
DemographicsRating | RankFemale Poverty
Immigrants | Switzerland
85.8
/100
|
#134
Excellent
12.9%
French
85.6
/100
|
#135
Excellent
12.9%
Peruvians
85.2
/100
|
#136
Excellent
12.9%
Chileans
84.7
/100
|
#137
Excellent
12.9%
Immigrants | France
83.6
/100
|
#138
Excellent
12.9%
Basques
83.1
/100
|
#139
Excellent
12.9%
Pakistanis
83.0
/100
|
#140
Excellent
12.9%
Icelanders
81.1
/100
|
#141
Excellent
13.0%
Brazilians
80.5
/100
|
#142
Excellent
13.0%
Immigrants | Malaysia
80.4
/100
|
#143
Excellent
13.0%
Afghans
79.8
/100
|
#144
Good
13.0%
Syrians
79.6
/100
|
#145
Good
13.0%
Immigrants | Peru
79.1
/100
|
#146
Good
13.0%
Immigrants | Kazakhstan
78.6
/100
|
#147
Good
13.0%
Yugoslavians
76.9
/100
|
#148
Good
13.1%

Demographics Similar to Scotch-Irish by Female Poverty

In terms of female poverty, the demographic groups most similar to Scotch-Irish are Ethiopian (13.3%, a difference of 0.020%), Guamanian/Chamorro (13.3%, a difference of 0.030%), Immigrants from Albania (13.3%, a difference of 0.030%), Immigrants from Ethiopia (13.3%, a difference of 0.040%), and Immigrants from Nepal (13.3%, a difference of 0.070%).
DemographicsRating | RankFemale Poverty
Pennsylvania Germans
67.3
/100
|
#158
Good
13.2%
Costa Ricans
63.6
/100
|
#159
Good
13.3%
Immigrants | Nepal
62.7
/100
|
#160
Good
13.3%
Immigrants | Ethiopia
62.5
/100
|
#161
Good
13.3%
Guamanians/Chamorros
62.4
/100
|
#162
Good
13.3%
Immigrants | Albania
62.4
/100
|
#163
Good
13.3%
Ethiopians
62.3
/100
|
#164
Good
13.3%
Scotch-Irish
62.1
/100
|
#165
Good
13.3%
Immigrants | Oceania
59.7
/100
|
#166
Average
13.3%
Immigrants | Chile
57.4
/100
|
#167
Average
13.3%
Aleuts
56.7
/100
|
#168
Average
13.4%
Lebanese
55.9
/100
|
#169
Average
13.4%
Colombians
55.7
/100
|
#170
Average
13.4%
Whites/Caucasians
54.6
/100
|
#171
Average
13.4%
Mongolians
53.6
/100
|
#172
Average
13.4%