Icelander vs Immigrants from Malaysia Single Father Poverty
COMPARE
Icelander
Immigrants from Malaysia
Single Father Poverty
Single Father Poverty Comparison
Icelanders
Immigrants from Malaysia
14.5%
SINGLE FATHER POVERTY
100.0/ 100
METRIC RATING
31st/ 347
METRIC RANK
15.2%
SINGLE FATHER POVERTY
99.8/ 100
METRIC RATING
65th/ 347
METRIC RANK
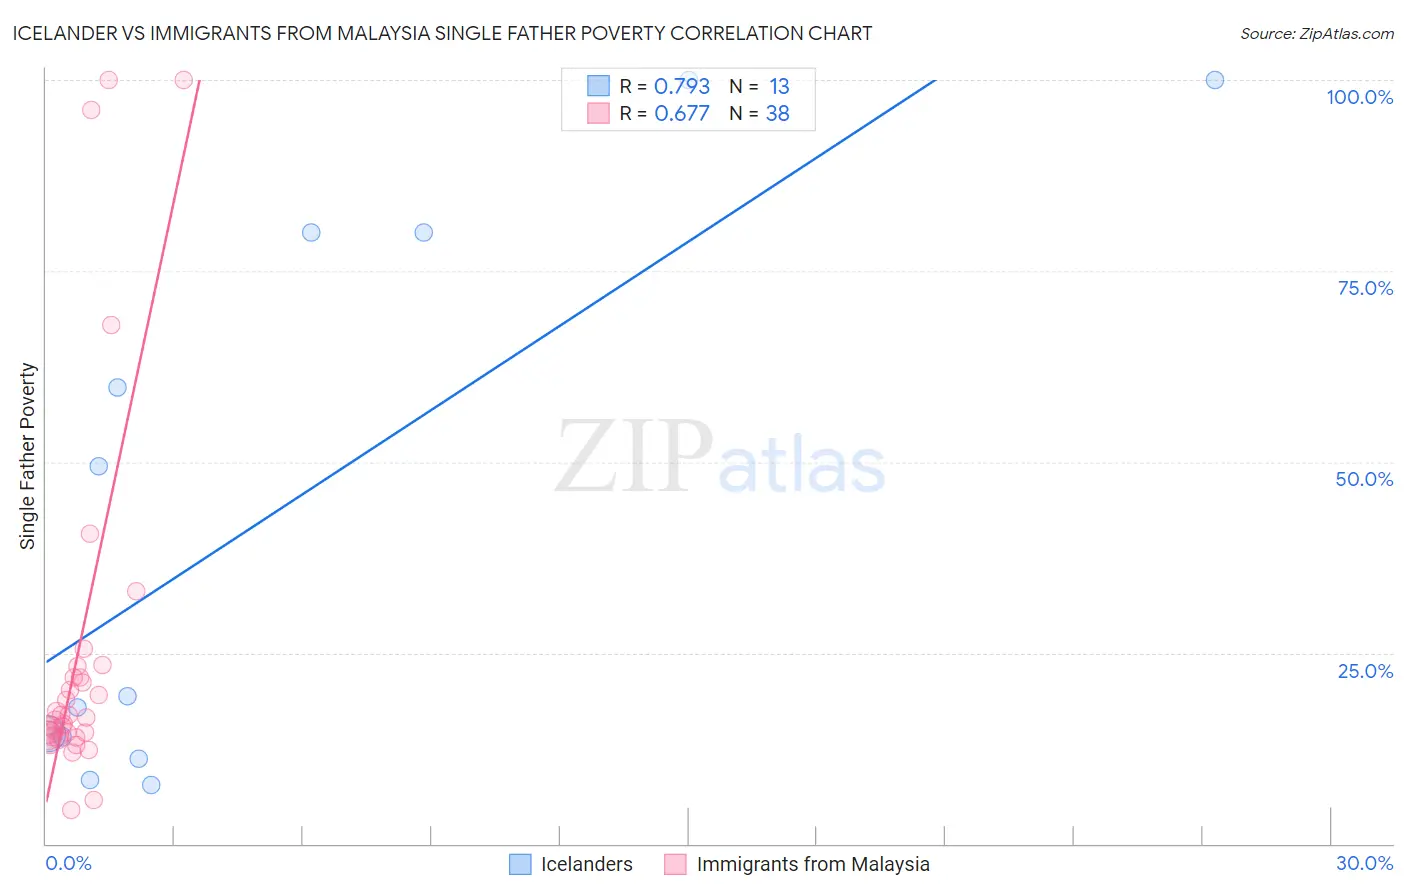
Icelander vs Immigrants from Malaysia Single Father Poverty Correlation Chart
The statistical analysis conducted on geographies consisting of 135,441,299 people shows a strong positive correlation between the proportion of Icelanders and poverty level among single fathers in the United States with a correlation coefficient (R) of 0.793 and weighted average of 14.5%. Similarly, the statistical analysis conducted on geographies consisting of 167,066,405 people shows a significant positive correlation between the proportion of Immigrants from Malaysia and poverty level among single fathers in the United States with a correlation coefficient (R) of 0.677 and weighted average of 15.2%, a difference of 4.6%.
Single Father Poverty Correlation Summary
| Measurement | Icelander | Immigrants from Malaysia |
| Minimum | 7.7% | 4.4% |
| Maximum | 100.0% | 100.0% |
| Range | 92.3% | 95.6% |
| Mean | 43.2% | 25.0% |
| Median | 19.3% | 16.4% |
| Interquartile 25% (IQ1) | 12.6% | 14.2% |
| Interquartile 75% (IQ3) | 80.0% | 21.7% |
| Interquartile Range (IQR) | 67.4% | 7.6% |
| Standard Deviation (Sample) | 36.4% | 24.2% |
| Standard Deviation (Population) | 34.9% | 23.9% |
Similar Demographics by Single Father Poverty
Demographics Similar to Icelanders by Single Father Poverty
In terms of single father poverty, the demographic groups most similar to Icelanders are Thai (14.5%, a difference of 0.080%), Somali (14.5%, a difference of 0.13%), Asian (14.6%, a difference of 0.15%), Immigrants from South Central Asia (14.5%, a difference of 0.23%), and Okinawan (14.6%, a difference of 0.71%).
| Demographics | Rating | Rank | Single Father Poverty |
| Immigrants | South Eastern Asia | 100.0 /100 | #24 | Exceptional 14.4% |
| Iranians | 100.0 /100 | #25 | Exceptional 14.4% |
| Spanish American Indians | 100.0 /100 | #26 | Exceptional 14.4% |
| Nepalese | 100.0 /100 | #27 | Exceptional 14.4% |
| Immigrants | South Central Asia | 100.0 /100 | #28 | Exceptional 14.5% |
| Somalis | 100.0 /100 | #29 | Exceptional 14.5% |
| Thais | 100.0 /100 | #30 | Exceptional 14.5% |
| Icelanders | 100.0 /100 | #31 | Exceptional 14.5% |
| Asians | 100.0 /100 | #32 | Exceptional 14.6% |
| Okinawans | 100.0 /100 | #33 | Exceptional 14.6% |
| Egyptians | 100.0 /100 | #34 | Exceptional 14.7% |
| Immigrants | Bolivia | 100.0 /100 | #35 | Exceptional 14.7% |
| Immigrants | Indonesia | 100.0 /100 | #36 | Exceptional 14.7% |
| Immigrants | Eastern Africa | 100.0 /100 | #37 | Exceptional 14.7% |
| Bolivians | 100.0 /100 | #38 | Exceptional 14.7% |
Demographics Similar to Immigrants from Malaysia by Single Father Poverty
In terms of single father poverty, the demographic groups most similar to Immigrants from Malaysia are Immigrants from Moldova (15.2%, a difference of 0.020%), Bangladeshi (15.2%, a difference of 0.090%), Paraguayan (15.2%, a difference of 0.11%), Immigrants from Sweden (15.2%, a difference of 0.16%), and Immigrants from Cameroon (15.2%, a difference of 0.20%).
| Demographics | Rating | Rank | Single Father Poverty |
| Hawaiians | 99.9 /100 | #58 | Exceptional 15.1% |
| Guamanians/Chamorros | 99.9 /100 | #59 | Exceptional 15.1% |
| Puget Sound Salish | 99.8 /100 | #60 | Exceptional 15.2% |
| Immigrants | Bosnia and Herzegovina | 99.8 /100 | #61 | Exceptional 15.2% |
| Immigrants | Armenia | 99.8 /100 | #62 | Exceptional 15.2% |
| Immigrants | Sweden | 99.8 /100 | #63 | Exceptional 15.2% |
| Bangladeshis | 99.8 /100 | #64 | Exceptional 15.2% |
| Immigrants | Malaysia | 99.8 /100 | #65 | Exceptional 15.2% |
| Immigrants | Moldova | 99.8 /100 | #66 | Exceptional 15.2% |
| Paraguayans | 99.7 /100 | #67 | Exceptional 15.2% |
| Immigrants | Cameroon | 99.7 /100 | #68 | Exceptional 15.2% |
| Japanese | 99.7 /100 | #69 | Exceptional 15.2% |
| Mongolians | 99.7 /100 | #70 | Exceptional 15.3% |
| Immigrants | Brazil | 99.6 /100 | #71 | Exceptional 15.3% |
| Immigrants | Lithuania | 99.6 /100 | #72 | Exceptional 15.3% |