Icelander vs Immigrants from Grenada Seniors Poverty Over the Age of 75

COMPARE

Icelander
Race
Ancestry
AfghanAfricanAlaska NativeAlaskan AthabascanAlbanianAleutAlsatianAmericanApacheArabArapahoArgentineanArmenianAssyrian/Chaldean/SyriacAustralianAustrianBahamianBangladeshiBarbadianBasqueBelgianBelizeanBermudanBhutaneseBlackfeetBolivianBrazilianBritishBritish West IndianBulgarianBurmeseCajunCambodianCanadianCape VerdeanCarpatho RusynCelticCentral AmericanCentral American IndianCherokeeCheyenneChickasawChileanChineseChippewaChoctawColombianColvilleComancheCosta RicanCreeCreekCroatianCrowCubanCypriotCzechCzechoslovakianDanishDelawareDominicanDutchDutch West IndianEastern EuropeanEcuadorianEgyptianEnglishEstonianEthiopianEuropeanFijianFilipinoFinnishFrenchFrench American IndianFrench CanadianGermanGerman RussianGhanaianGreekGuamanian/ChamorroGuatemalanGuyaneseHaitianHmongHonduranHopiHoumaHungarianIcelanderIndian (Asian)IndonesianInupiatIranianIraqiIrishIroquoisIsraeliItalianJamaicanJapaneseJordanianKenyanKiowaKoreanLaotianLatvianLebaneseLiberianLithuanianLumbeeLuxembourgerMacedonianMalaysianMalteseMarshalleseMenomineeMexicanMexican American IndianMongolianMoroccanNative HawaiianNavajoNepaleseNew ZealanderNicaraguanNigerianNorthern EuropeanNorwegianOkinawanOsageOttawaPaiutePakistaniPalestinianPanamanianParaguayanPennsylvania GermanPeruvianPimaPolishPortuguesePotawatomiPuebloPuerto RicanPuget Sound SalishRomanianRussianSalvadoranSamoanScandinavianScotch-IrishScottishSeminoleSenegaleseSerbianShoshoneSierra LeoneanSiouxSlavicSlovakSloveneSomaliSouth AfricanSouth AmericanSouth American IndianSoviet UnionSpaniardSpanishSpanish AmericanSpanish American IndianSri LankanSubsaharan AfricanSudaneseSwedishSwissSyrianTaiwaneseThaiTlingit-HaidaTohono O'OdhamTonganTrinidadian and TobagonianTsimshianTurkishU.S. Virgin IslanderUgandanUkrainianUruguayanUteVenezuelanVietnameseWelshWest IndianYakamaYaquiYugoslavianYumanYup'ikZimbabwean
Immigration
NonimmigrantsImmigrantsAfghanistanAfricaAlbaniaArgentinaArmeniaAsiaAustraliaAustriaBahamasBangladeshBarbadosBelarusBelgiumBelizeBoliviaBosnia and HerzegovinaBrazilBulgariaBurma/MyanmarCabo VerdeCambodiaCameroonCanadaCaribbeanCentral AmericaChileChinaColombiaCongoCosta RicaCroatiaCubaCzechoslovakiaDenmarkDominicaDominican RepublicEastern AfricaEastern AsiaEastern EuropeEcuadorEgyptEl SalvadorEnglandEritreaEthiopiaEuropeFijiFranceGermanyGhanaGreeceGuatemalaGuyanaHaitiHondurasHong KongHungaryIndiaIndonesiaIranIraqIrelandIsraelItalyJamaicaJapanJordanKazakhstanKenyaKoreaKuwaitLaosLatin AmericaLatviaLebanonLiberiaLithuaniaMalaysiaMexicoMicronesiaMiddle AfricaMoldovaMoroccoNepalNetherlandsNicaraguaNigeriaNorth AmericaNorth MacedoniaNorthern AfricaNorthern EuropeNorwayOceaniaPakistanPanamaPeruPhilippinesPolandPortugalRomaniaRussiaSaudi ArabiaScotlandSenegalSerbiaSierra LeoneSingaporeSomaliaSouth AfricaSouth AmericaSouth Central AsiaSouth Eastern AsiaSouthern EuropeSpainSri LankaSt. Vincent and the GrenadinesSudanSwedenSwitzerlandSyriaTaiwanThailandTrinidad and TobagoTurkeyUgandaUkraineUruguayUzbekistanVenezuelaVietnamWest IndiesWestern AfricaWestern AsiaWestern EuropeYemenZaireZimbabweAzores
Immigrants from Grenada
Race
Ancestry
AfghanAfricanAlaska NativeAlaskan AthabascanAlbanianAleutAlsatianAmericanApacheArabArapahoArgentineanArmenianAssyrian/Chaldean/SyriacAustralianAustrianBahamianBangladeshiBarbadianBasqueBelgianBelizeanBermudanBhutaneseBlackfeetBolivianBrazilianBritishBritish West IndianBulgarianBurmeseCajunCambodianCanadianCape VerdeanCarpatho RusynCelticCentral AmericanCentral American IndianCherokeeCheyenneChickasawChileanChineseChippewaChoctawColombianColvilleComancheCosta RicanCreeCreekCroatianCrowCubanCypriotCzechCzechoslovakianDanishDelawareDominicanDutchDutch West IndianEastern EuropeanEcuadorianEgyptianEnglishEstonianEthiopianEuropeanFijianFilipinoFinnishFrenchFrench American IndianFrench CanadianGermanGerman RussianGhanaianGreekGuamanian/ChamorroGuatemalanGuyaneseHaitianHmongHonduranHopiHoumaHungarianIndian (Asian)IndonesianInupiatIranianIraqiIrishIroquoisIsraeliItalianJamaicanJapaneseJordanianKenyanKiowaKoreanLaotianLatvianLebaneseLiberianLithuanianLumbeeLuxembourgerMacedonianMalaysianMalteseMarshalleseMenomineeMexicanMexican American IndianMongolianMoroccanNative HawaiianNavajoNepaleseNew ZealanderNicaraguanNigerianNorthern EuropeanNorwegianOkinawanOsageOttawaPaiutePakistaniPalestinianPanamanianParaguayanPennsylvania GermanPeruvianPimaPolishPortuguesePotawatomiPuebloPuerto RicanPuget Sound SalishRomanianRussianSalvadoranSamoanScandinavianScotch-IrishScottishSeminoleSenegaleseSerbianShoshoneSierra LeoneanSiouxSlavicSlovakSloveneSomaliSouth AfricanSouth AmericanSouth American IndianSoviet UnionSpaniardSpanishSpanish AmericanSpanish American IndianSri LankanSubsaharan AfricanSudaneseSwedishSwissSyrianTaiwaneseThaiTlingit-HaidaTohono O'OdhamTonganTrinidadian and TobagonianTsimshianTurkishU.S. Virgin IslanderUgandanUkrainianUruguayanUteVenezuelanVietnameseWelshWest IndianYakamaYaquiYugoslavianYumanYup'ikZimbabwean
Immigration
NonimmigrantsImmigrantsAfghanistanAfricaAlbaniaArgentinaArmeniaAsiaAustraliaAustriaBahamasBangladeshBarbadosBelarusBelgiumBelizeBoliviaBosnia and HerzegovinaBrazilBulgariaBurma/MyanmarCabo VerdeCambodiaCameroonCanadaCaribbeanCentral AmericaChileChinaColombiaCongoCosta RicaCroatiaCubaCzechoslovakiaDenmarkDominicaDominican RepublicEastern AfricaEastern AsiaEastern EuropeEcuadorEgyptEl SalvadorEnglandEritreaEthiopiaEuropeFijiFranceGermanyGhanaGreeceGrenadaGuatemalaGuyanaHaitiHondurasHong KongHungaryIndiaIndonesiaIranIraqIrelandIsraelItalyJamaicaJapanJordanKazakhstanKenyaKoreaKuwaitLaosLatin AmericaLatviaLebanonLiberiaLithuaniaMalaysiaMexicoMicronesiaMiddle AfricaMoldovaMoroccoNepalNetherlandsNicaraguaNigeriaNorth AmericaNorth MacedoniaNorthern AfricaNorthern EuropeNorwayOceaniaPakistanPanamaPeruPhilippinesPolandPortugalRomaniaRussiaSaudi ArabiaScotlandSenegalSerbiaSierra LeoneSingaporeSomaliaSouth AfricaSouth AmericaSouth Central AsiaSouth Eastern AsiaSouthern EuropeSpainSri LankaSt. Vincent and the GrenadinesSudanSwedenSwitzerlandSyriaTaiwanThailandTrinidad and TobagoTurkeyUgandaUkraineUruguayUzbekistanVenezuelaVietnamWest IndiesWestern AfricaWestern AsiaWestern EuropeYemenZaireZimbabweAzores
Seniors Poverty Over the Age of 75
Income
Poverty
Unemployment
Labor Participation
Family Structure
Vehicle Availability
Education Level
Disability

Seniors Poverty Over the Age of 75 Comparison

Icelanders

Immigrants from Grenada

Excellent
Tragic
11.7%
SENIORS POVERTY OVER THE AGE OF 75
85.7/ 100
METRIC RATING
117th/ 347
METRIC RANK
17.8%
SENIORS POVERTY OVER THE AGE OF 75
0.0/ 100
METRIC RATING
334th/ 347
METRIC RANK

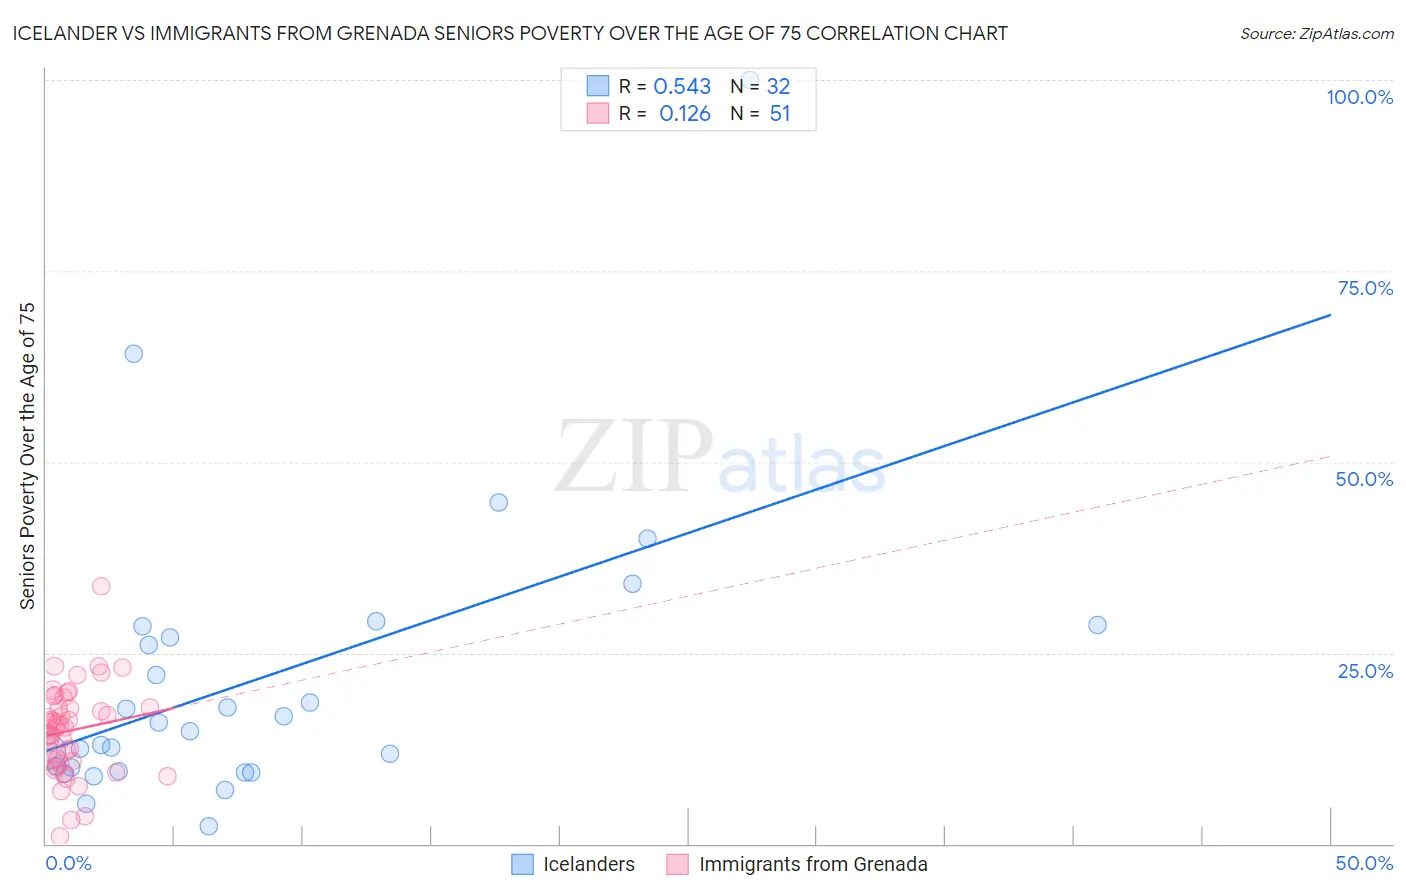
Icelander vs Immigrants from Grenada Seniors Poverty Over the Age of 75 Correlation Chart

The statistical analysis conducted on geographies consisting of 158,818,038 people shows a substantial positive correlation between the proportion of Icelanders and poverty level among seniors over the age of 75 in the United States with a correlation coefficient (R) of 0.543 and weighted average of 11.7%. Similarly, the statistical analysis conducted on geographies consisting of 66,944,348 people shows a poor positive correlation between the proportion of Immigrants from Grenada and poverty level among seniors over the age of 75 in the United States with a correlation coefficient (R) of 0.126 and weighted average of 17.8%, a difference of 51.9%.
Icelander vs Immigrants from Grenada Seniors Poverty Over the Age of 75

Seniors Poverty Over the Age of 75 Correlation Summary

MeasurementIcelanderImmigrants from Grenada
Minimum2.3%0.99%
Maximum100.0%33.8%
Range97.7%32.8%
Mean21.5%14.8%
Median15.3%15.3%
Interquartile 25% (IQ1)9.7%10.8%
Interquartile 75% (IQ3)27.7%17.8%
Interquartile Range (IQR)18.0%7.0%
Standard Deviation (Sample)19.4%5.9%
Standard Deviation (Population)19.1%5.8%

Similar Demographics by Seniors Poverty Over the Age of 75

Demographics Similar to Icelanders by Seniors Poverty Over the Age of 75

In terms of seniors poverty over the age of 75, the demographic groups most similar to Icelanders are Immigrants from Zimbabwe (11.7%, a difference of 0.030%), New Zealander (11.7%, a difference of 0.11%), Iraqi (11.7%, a difference of 0.11%), Immigrants from Uganda (11.8%, a difference of 0.16%), and Immigrants from Nepal (11.8%, a difference of 0.20%).
DemographicsRating | RankSeniors Poverty Over the Age of 75
Immigrants | Jordan
88.7
/100
|
#110
Excellent
11.7%
Burmese
88.7
/100
|
#111
Excellent
11.7%
Immigrants | Bolivia
88.4
/100
|
#112
Excellent
11.7%
Immigrants | Czechoslovakia
87.0
/100
|
#113
Excellent
11.7%
Ukrainians
86.9
/100
|
#114
Excellent
11.7%
New Zealanders
86.3
/100
|
#115
Excellent
11.7%
Iraqis
86.3
/100
|
#116
Excellent
11.7%
Icelanders
85.7
/100
|
#117
Excellent
11.7%
Immigrants | Zimbabwe
85.5
/100
|
#118
Excellent
11.7%
Immigrants | Uganda
84.8
/100
|
#119
Excellent
11.8%
Immigrants | Nepal
84.5
/100
|
#120
Excellent
11.8%
Malaysians
84.1
/100
|
#121
Excellent
11.8%
Pakistanis
84.0
/100
|
#122
Excellent
11.8%
Immigrants | Italy
84.0
/100
|
#123
Excellent
11.8%
Fijians
83.8
/100
|
#124
Excellent
11.8%

Demographics Similar to Immigrants from Grenada by Seniors Poverty Over the Age of 75

In terms of seniors poverty over the age of 75, the demographic groups most similar to Immigrants from Grenada are Cuban (18.0%, a difference of 0.59%), Immigrants from Nicaragua (17.6%, a difference of 1.5%), Immigrants from St. Vincent and the Grenadines (17.5%, a difference of 2.0%), Immigrants from Armenia (17.5%, a difference of 2.2%), and Immigrants from Caribbean (18.2%, a difference of 2.2%).
DemographicsRating | RankSeniors Poverty Over the Age of 75
Sioux
0.0
/100
|
#327
Tragic
16.8%
Cape Verdeans
0.0
/100
|
#328
Tragic
16.8%
Immigrants | Dominica
0.0
/100
|
#329
Tragic
17.0%
British West Indians
0.0
/100
|
#330
Tragic
17.4%
Immigrants | Armenia
0.0
/100
|
#331
Tragic
17.5%
Immigrants | St. Vincent and the Grenadines
0.0
/100
|
#332
Tragic
17.5%
Immigrants | Nicaragua
0.0
/100
|
#333
Tragic
17.6%
Immigrants | Grenada
0.0
/100
|
#334
Tragic
17.8%
Cubans
0.0
/100
|
#335
Tragic
18.0%
Immigrants | Caribbean
0.0
/100
|
#336
Tragic
18.2%
Yakama
0.0
/100
|
#337
Tragic
18.3%
Immigrants | Cabo Verde
0.0
/100
|
#338
Tragic
18.5%
Hopi
0.0
/100
|
#339
Tragic
18.9%
Tohono O'odham
0.0
/100
|
#340
Tragic
19.1%
Navajo
0.0
/100
|
#341
Tragic
19.4%