Hungarian vs South American Female Poverty Among 18-24 Year Olds
COMPARE
Hungarian
South American
Female Poverty Among 18-24 Year Olds
Female Poverty Among 18-24 Year Olds Comparison
Hungarians
South Americans
19.8%
FEMALE POVERTY AMONG 18-24 YEAR OLDS
76.6/ 100
METRIC RATING
155th/ 347
METRIC RANK
18.0%
FEMALE POVERTY AMONG 18-24 YEAR OLDS
100.0/ 100
METRIC RATING
38th/ 347
METRIC RANK
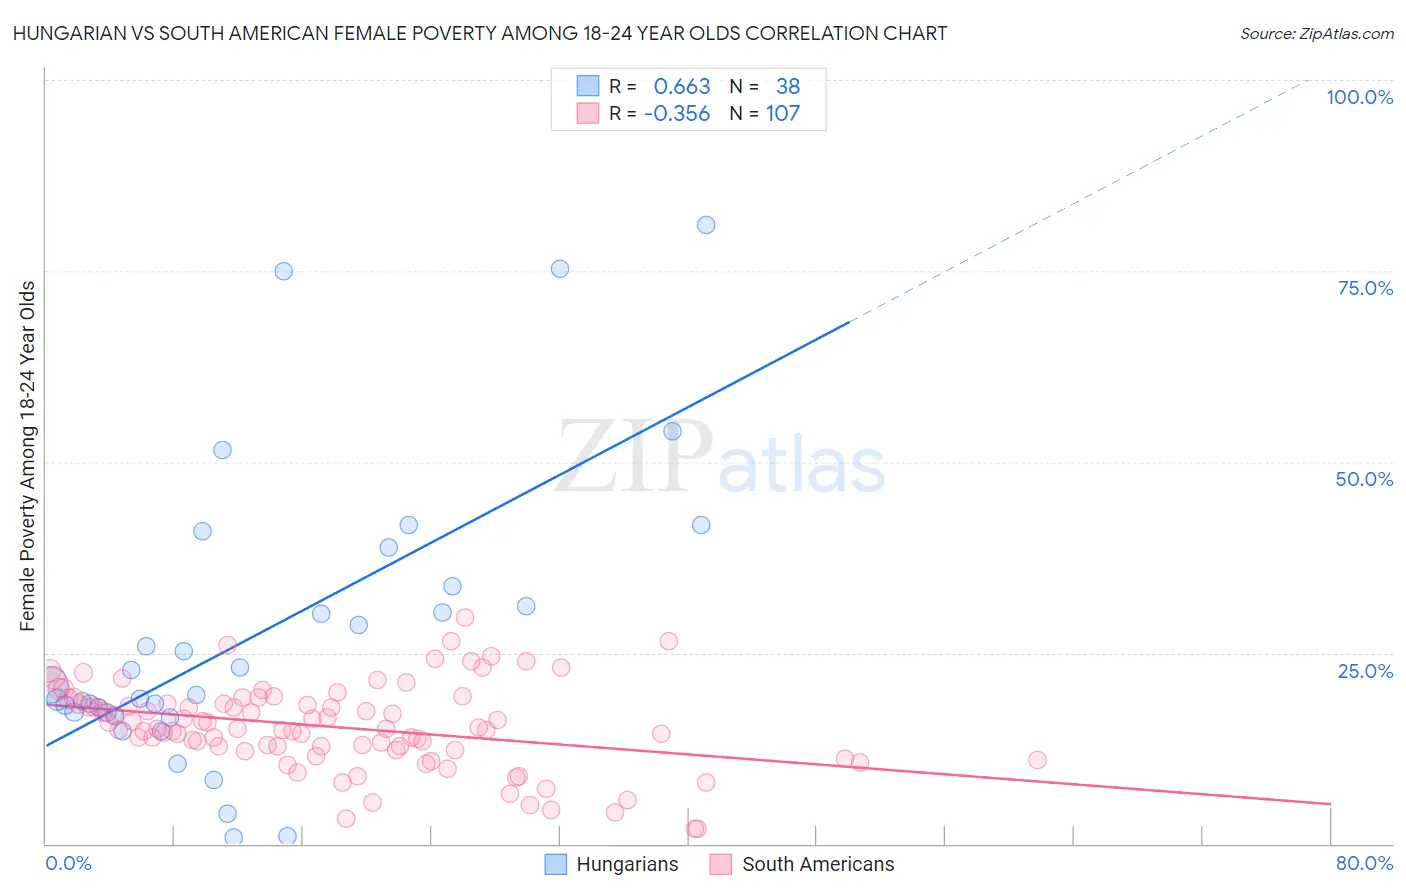
Hungarian vs South American Female Poverty Among 18-24 Year Olds Correlation Chart
The statistical analysis conducted on geographies consisting of 465,185,254 people shows a significant positive correlation between the proportion of Hungarians and poverty level among females between the ages 18 and 24 in the United States with a correlation coefficient (R) of 0.663 and weighted average of 19.8%. Similarly, the statistical analysis conducted on geographies consisting of 476,121,992 people shows a mild negative correlation between the proportion of South Americans and poverty level among females between the ages 18 and 24 in the United States with a correlation coefficient (R) of -0.356 and weighted average of 18.0%, a difference of 10.3%.
Female Poverty Among 18-24 Year Olds Correlation Summary
| Measurement | Hungarian | South American |
| Minimum | 0.77% | 2.0% |
| Maximum | 81.0% | 29.7% |
| Range | 80.3% | 27.7% |
| Mean | 27.4% | 15.3% |
| Median | 20.1% | 15.1% |
| Interquartile 25% (IQ1) | 17.1% | 12.3% |
| Interquartile 75% (IQ3) | 33.7% | 18.4% |
| Interquartile Range (IQR) | 16.5% | 6.0% |
| Standard Deviation (Sample) | 19.2% | 5.5% |
| Standard Deviation (Population) | 18.9% | 5.5% |
Similar Demographics by Female Poverty Among 18-24 Year Olds
Demographics Similar to Hungarians by Female Poverty Among 18-24 Year Olds
In terms of female poverty among 18-24 year olds, the demographic groups most similar to Hungarians are Immigrants from Zimbabwe (19.8%, a difference of 0.0%), Immigrants from Belgium (19.8%, a difference of 0.010%), Danish (19.8%, a difference of 0.070%), Immigrants from Lebanon (19.8%, a difference of 0.090%), and Immigrants from Japan (19.8%, a difference of 0.11%).
| Demographics | Rating | Rank | Female Poverty Among 18-24 Year Olds |
| Immigrants | Latin America | 81.3 /100 | #148 | Excellent 19.7% |
| Immigrants | Oceania | 81.2 /100 | #149 | Excellent 19.7% |
| Syrians | 80.2 /100 | #150 | Excellent 19.8% |
| Immigrants | Eastern Asia | 79.7 /100 | #151 | Good 19.8% |
| Yugoslavians | 79.0 /100 | #152 | Good 19.8% |
| Immigrants | Japan | 78.1 /100 | #153 | Good 19.8% |
| Immigrants | Zimbabwe | 76.7 /100 | #154 | Good 19.8% |
| Hungarians | 76.6 /100 | #155 | Good 19.8% |
| Immigrants | Belgium | 76.4 /100 | #156 | Good 19.8% |
| Danes | 75.5 /100 | #157 | Good 19.8% |
| Immigrants | Lebanon | 75.3 /100 | #158 | Good 19.8% |
| Trinidadians and Tobagonians | 74.4 /100 | #159 | Good 19.8% |
| Pakistanis | 74.1 /100 | #160 | Good 19.8% |
| Immigrants | Belize | 74.1 /100 | #161 | Good 19.8% |
| French Canadians | 73.0 /100 | #162 | Good 19.9% |
Demographics Similar to South Americans by Female Poverty Among 18-24 Year Olds
In terms of female poverty among 18-24 year olds, the demographic groups most similar to South Americans are Puget Sound Salish (18.0%, a difference of 0.21%), Immigrants from Croatia (17.9%, a difference of 0.22%), Immigrants from Romania (18.0%, a difference of 0.24%), Immigrants from Argentina (18.0%, a difference of 0.25%), and Immigrants from South America (17.9%, a difference of 0.28%).
| Demographics | Rating | Rank | Female Poverty Among 18-24 Year Olds |
| Immigrants | Vietnam | 100.0 /100 | #31 | Exceptional 17.8% |
| Immigrants | Moldova | 100.0 /100 | #32 | Exceptional 17.9% |
| Native Hawaiians | 100.0 /100 | #33 | Exceptional 17.9% |
| Immigrants | Nicaragua | 100.0 /100 | #34 | Exceptional 17.9% |
| Immigrants | Greece | 100.0 /100 | #35 | Exceptional 17.9% |
| Immigrants | South America | 100.0 /100 | #36 | Exceptional 17.9% |
| Immigrants | Croatia | 100.0 /100 | #37 | Exceptional 17.9% |
| South Americans | 100.0 /100 | #38 | Exceptional 18.0% |
| Puget Sound Salish | 100.0 /100 | #39 | Exceptional 18.0% |
| Immigrants | Romania | 100.0 /100 | #40 | Exceptional 18.0% |
| Immigrants | Argentina | 100.0 /100 | #41 | Exceptional 18.0% |
| Bulgarians | 100.0 /100 | #42 | Exceptional 18.1% |
| Macedonians | 100.0 /100 | #43 | Exceptional 18.1% |
| Nicaraguans | 100.0 /100 | #44 | Exceptional 18.1% |
| Spanish American Indians | 100.0 /100 | #45 | Exceptional 18.1% |