Hungarian vs Mexican American Indian Seniors Poverty Over the Age of 75
COMPARE
Hungarian
Mexican American Indian
Seniors Poverty Over the Age of 75
Seniors Poverty Over the Age of 75 Comparison
Hungarians
Mexican American Indians
11.2%
SENIORS POVERTY OVER THE AGE OF 75
98.1/ 100
METRIC RATING
55th/ 347
METRIC RANK
13.6%
SENIORS POVERTY OVER THE AGE OF 75
0.3/ 100
METRIC RATING
250th/ 347
METRIC RANK
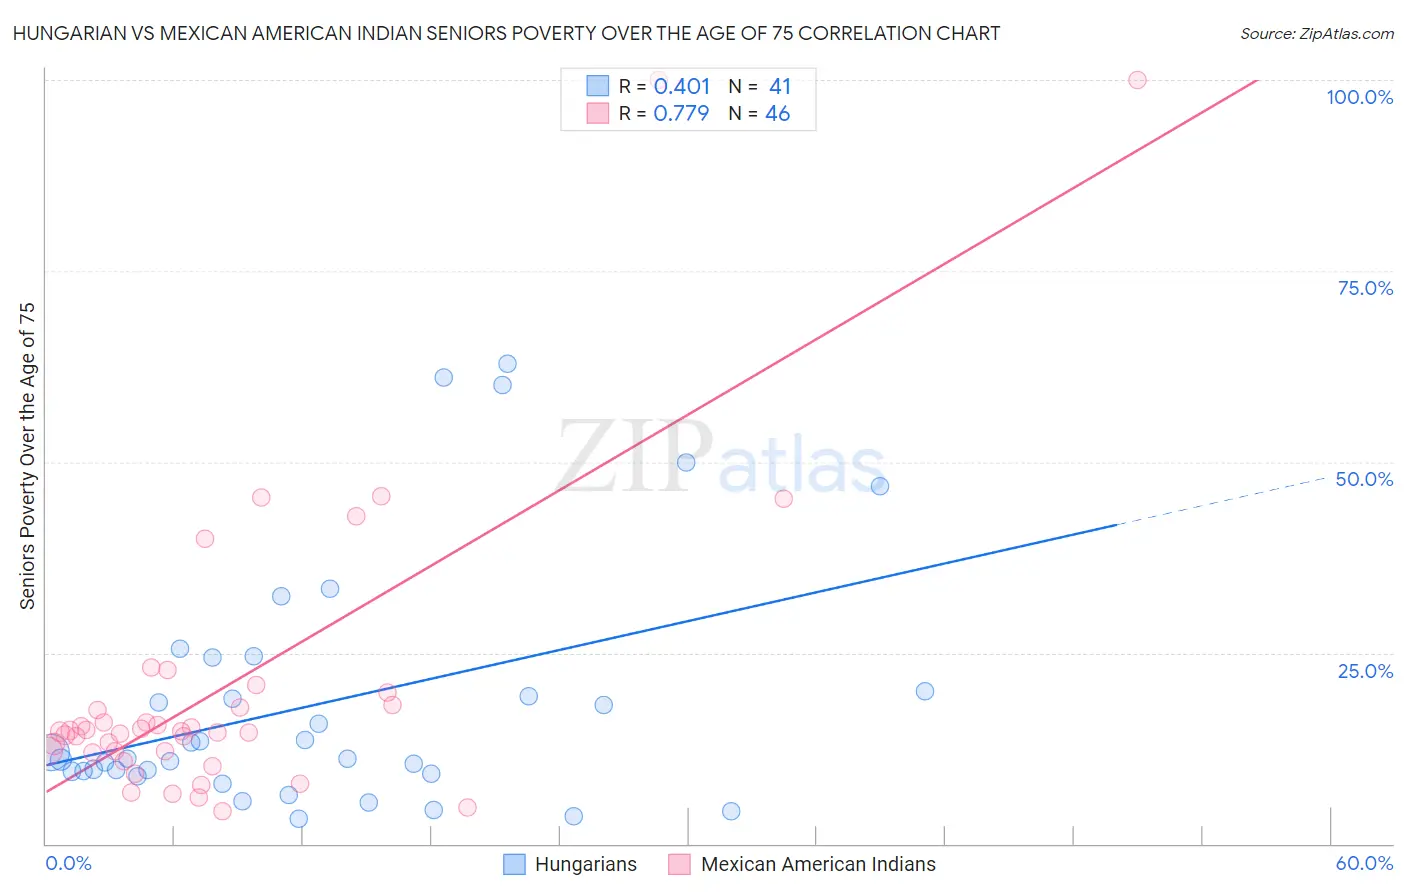
Hungarian vs Mexican American Indian Seniors Poverty Over the Age of 75 Correlation Chart
The statistical analysis conducted on geographies consisting of 477,160,041 people shows a moderate positive correlation between the proportion of Hungarians and poverty level among seniors over the age of 75 in the United States with a correlation coefficient (R) of 0.401 and weighted average of 11.2%. Similarly, the statistical analysis conducted on geographies consisting of 314,926,710 people shows a strong positive correlation between the proportion of Mexican American Indians and poverty level among seniors over the age of 75 in the United States with a correlation coefficient (R) of 0.779 and weighted average of 13.6%, a difference of 21.5%.
Seniors Poverty Over the Age of 75 Correlation Summary
| Measurement | Hungarian | Mexican American Indian |
| Minimum | 3.3% | 4.2% |
| Maximum | 62.8% | 100.0% |
| Range | 59.5% | 95.8% |
| Mean | 18.4% | 20.6% |
| Median | 11.2% | 14.7% |
| Interquartile 25% (IQ1) | 9.3% | 12.1% |
| Interquartile 75% (IQ3) | 22.2% | 18.1% |
| Interquartile Range (IQR) | 12.9% | 6.1% |
| Standard Deviation (Sample) | 16.1% | 20.0% |
| Standard Deviation (Population) | 15.9% | 19.8% |
Similar Demographics by Seniors Poverty Over the Age of 75
Demographics Similar to Hungarians by Seniors Poverty Over the Age of 75
In terms of seniors poverty over the age of 75, the demographic groups most similar to Hungarians are Slavic (11.2%, a difference of 0.010%), Afghan (11.2%, a difference of 0.070%), Immigrants from Canada (11.2%, a difference of 0.24%), Yugoslavian (11.2%, a difference of 0.28%), and Immigrants from Netherlands (11.2%, a difference of 0.36%).
| Demographics | Rating | Rank | Seniors Poverty Over the Age of 75 |
| French | 98.7 /100 | #48 | Exceptional 11.1% |
| Samoans | 98.7 /100 | #49 | Exceptional 11.1% |
| Serbians | 98.6 /100 | #50 | Exceptional 11.1% |
| Immigrants | North Macedonia | 98.6 /100 | #51 | Exceptional 11.1% |
| Zimbabweans | 98.5 /100 | #52 | Exceptional 11.2% |
| Immigrants | England | 98.4 /100 | #53 | Exceptional 11.2% |
| Afghans | 98.2 /100 | #54 | Exceptional 11.2% |
| Hungarians | 98.1 /100 | #55 | Exceptional 11.2% |
| Slavs | 98.1 /100 | #56 | Exceptional 11.2% |
| Immigrants | Canada | 97.9 /100 | #57 | Exceptional 11.2% |
| Yugoslavians | 97.9 /100 | #58 | Exceptional 11.2% |
| Immigrants | Netherlands | 97.8 /100 | #59 | Exceptional 11.2% |
| Eastern Europeans | 97.7 /100 | #60 | Exceptional 11.3% |
| Canadians | 97.7 /100 | #61 | Exceptional 11.3% |
| Immigrants | North America | 97.6 /100 | #62 | Exceptional 11.3% |
Demographics Similar to Mexican American Indians by Seniors Poverty Over the Age of 75
In terms of seniors poverty over the age of 75, the demographic groups most similar to Mexican American Indians are Immigrants from Albania (13.6%, a difference of 0.010%), African (13.6%, a difference of 0.020%), Immigrants from Ukraine (13.6%, a difference of 0.050%), Immigrants from Peru (13.7%, a difference of 0.33%), and Immigrants from Argentina (13.7%, a difference of 0.38%).
| Demographics | Rating | Rank | Seniors Poverty Over the Age of 75 |
| Dutch West Indians | 0.6 /100 | #243 | Tragic 13.5% |
| Spanish Americans | 0.5 /100 | #244 | Tragic 13.5% |
| Uruguayans | 0.5 /100 | #245 | Tragic 13.5% |
| Immigrants | Cambodia | 0.4 /100 | #246 | Tragic 13.6% |
| Immigrants | Ukraine | 0.3 /100 | #247 | Tragic 13.6% |
| Africans | 0.3 /100 | #248 | Tragic 13.6% |
| Immigrants | Albania | 0.3 /100 | #249 | Tragic 13.6% |
| Mexican American Indians | 0.3 /100 | #250 | Tragic 13.6% |
| Immigrants | Peru | 0.3 /100 | #251 | Tragic 13.7% |
| Immigrants | Argentina | 0.3 /100 | #252 | Tragic 13.7% |
| Immigrants | Spain | 0.2 /100 | #253 | Tragic 13.7% |
| Blackfeet | 0.2 /100 | #254 | Tragic 13.7% |
| Immigrants | Belarus | 0.2 /100 | #255 | Tragic 13.8% |
| Inupiat | 0.1 /100 | #256 | Tragic 13.8% |
| Immigrants | Western Africa | 0.1 /100 | #257 | Tragic 13.9% |