Houma vs South African Child Poverty Under the Age of 5

COMPARE

Houma
Race
Ancestry
AfghanAfricanAlaska NativeAlaskan AthabascanAlbanianAleutAlsatianAmericanApacheArabArapahoArgentineanArmenianAssyrian/Chaldean/SyriacAustralianAustrianBahamianBangladeshiBarbadianBasqueBelgianBelizeanBermudanBhutaneseBlackfeetBolivianBrazilianBritishBritish West IndianBulgarianBurmeseCajunCambodianCanadianCape VerdeanCarpatho RusynCelticCentral AmericanCentral American IndianCherokeeCheyenneChickasawChileanChineseChippewaChoctawColombianColvilleComancheCosta RicanCreeCreekCroatianCrowCubanCypriotCzechCzechoslovakianDanishDelawareDominicanDutchDutch West IndianEastern EuropeanEcuadorianEgyptianEnglishEstonianEthiopianEuropeanFijianFilipinoFinnishFrenchFrench American IndianFrench CanadianGermanGerman RussianGhanaianGreekGuamanian/ChamorroGuatemalanGuyaneseHaitianHmongHonduranHopiHoumaHungarianIcelanderIndian (Asian)IndonesianInupiatIranianIraqiIrishIroquoisIsraeliItalianJamaicanJapaneseJordanianKenyanKiowaKoreanLaotianLatvianLebaneseLiberianLithuanianLumbeeLuxembourgerMacedonianMalaysianMalteseMarshalleseMenomineeMexicanMexican American IndianMongolianMoroccanNative HawaiianNavajoNepaleseNew ZealanderNicaraguanNigerianNorthern EuropeanNorwegianOkinawanOsageOttawaPaiutePakistaniPalestinianPanamanianParaguayanPennsylvania GermanPeruvianPimaPolishPortuguesePotawatomiPuebloPuerto RicanPuget Sound SalishRomanianRussianSalvadoranSamoanScandinavianScotch-IrishScottishSeminoleSenegaleseSerbianShoshoneSierra LeoneanSiouxSlavicSlovakSloveneSomaliSouth AmericanSouth American IndianSoviet UnionSpaniardSpanishSpanish AmericanSpanish American IndianSri LankanSubsaharan AfricanSudaneseSwedishSwissSyrianTaiwaneseThaiTlingit-HaidaTohono O'OdhamTonganTrinidadian and TobagonianTsimshianTurkishU.S. Virgin IslanderUgandanUkrainianUruguayanUteVenezuelanVietnameseWelshWest IndianYakamaYaquiYugoslavianYumanYup'ikZimbabwean
Immigration
NonimmigrantsImmigrantsAfghanistanAfricaAlbaniaArgentinaArmeniaAsiaAustraliaAustriaBahamasBangladeshBarbadosBelarusBelgiumBelizeBoliviaBosnia and HerzegovinaBrazilBulgariaBurma/MyanmarCabo VerdeCambodiaCameroonCanadaCaribbeanCentral AmericaChileChinaColombiaCongoCosta RicaCroatiaCubaCzechoslovakiaDenmarkDominicaDominican RepublicEastern AfricaEastern AsiaEastern EuropeEcuadorEgyptEl SalvadorEnglandEritreaEthiopiaEuropeFijiFranceGermanyGhanaGreeceGrenadaGuatemalaGuyanaHaitiHondurasHong KongHungaryIndiaIndonesiaIranIraqIrelandIsraelItalyJamaicaJapanJordanKazakhstanKenyaKoreaKuwaitLaosLatin AmericaLatviaLebanonLiberiaLithuaniaMalaysiaMexicoMicronesiaMiddle AfricaMoldovaMoroccoNepalNetherlandsNicaraguaNigeriaNorth AmericaNorth MacedoniaNorthern AfricaNorthern EuropeNorwayOceaniaPakistanPanamaPeruPhilippinesPolandPortugalRomaniaRussiaSaudi ArabiaScotlandSenegalSerbiaSierra LeoneSingaporeSomaliaSouth AfricaSouth AmericaSouth Central AsiaSouth Eastern AsiaSouthern EuropeSpainSri LankaSt. Vincent and the GrenadinesSudanSwedenSwitzerlandSyriaTaiwanThailandTrinidad and TobagoTurkeyUgandaUkraineUruguayUzbekistanVenezuelaVietnamWest IndiesWestern AfricaWestern AsiaWestern EuropeYemenZaireZimbabweAzores
South African
Race
Ancestry
AfghanAfricanAlaska NativeAlaskan AthabascanAlbanianAleutAlsatianAmericanApacheArabArapahoArgentineanArmenianAssyrian/Chaldean/SyriacAustralianAustrianBahamianBangladeshiBarbadianBasqueBelgianBelizeanBermudanBhutaneseBlackfeetBolivianBrazilianBritishBritish West IndianBulgarianBurmeseCajunCambodianCanadianCape VerdeanCarpatho RusynCelticCentral AmericanCentral American IndianCherokeeCheyenneChickasawChileanChineseChippewaChoctawColombianColvilleComancheCosta RicanCreeCreekCroatianCrowCubanCypriotCzechCzechoslovakianDanishDelawareDominicanDutchDutch West IndianEastern EuropeanEcuadorianEgyptianEnglishEstonianEthiopianEuropeanFijianFilipinoFinnishFrenchFrench American IndianFrench CanadianGermanGerman RussianGhanaianGreekGuamanian/ChamorroGuatemalanGuyaneseHaitianHmongHonduranHopiHungarianIcelanderIndian (Asian)IndonesianInupiatIranianIraqiIrishIroquoisIsraeliItalianJamaicanJapaneseJordanianKenyanKiowaKoreanLaotianLatvianLebaneseLiberianLithuanianLumbeeLuxembourgerMacedonianMalaysianMalteseMarshalleseMenomineeMexicanMexican American IndianMongolianMoroccanNative HawaiianNavajoNepaleseNew ZealanderNicaraguanNigerianNorthern EuropeanNorwegianOkinawanOsageOttawaPaiutePakistaniPalestinianPanamanianParaguayanPennsylvania GermanPeruvianPimaPolishPortuguesePotawatomiPuebloPuerto RicanPuget Sound SalishRomanianRussianSalvadoranSamoanScandinavianScotch-IrishScottishSeminoleSenegaleseSerbianShoshoneSierra LeoneanSiouxSlavicSlovakSloveneSomaliSouth AfricanSouth AmericanSouth American IndianSoviet UnionSpaniardSpanishSpanish AmericanSpanish American IndianSri LankanSubsaharan AfricanSudaneseSwedishSwissSyrianTaiwaneseThaiTlingit-HaidaTohono O'OdhamTonganTrinidadian and TobagonianTsimshianTurkishU.S. Virgin IslanderUgandanUkrainianUruguayanUteVenezuelanVietnameseWelshWest IndianYakamaYaquiYugoslavianYumanYup'ikZimbabwean
Immigration
NonimmigrantsImmigrantsAfghanistanAfricaAlbaniaArgentinaArmeniaAsiaAustraliaAustriaBahamasBangladeshBarbadosBelarusBelgiumBelizeBoliviaBosnia and HerzegovinaBrazilBulgariaBurma/MyanmarCabo VerdeCambodiaCameroonCanadaCaribbeanCentral AmericaChileChinaColombiaCongoCosta RicaCroatiaCubaCzechoslovakiaDenmarkDominicaDominican RepublicEastern AfricaEastern AsiaEastern EuropeEcuadorEgyptEl SalvadorEnglandEritreaEthiopiaEuropeFijiFranceGermanyGhanaGreeceGrenadaGuatemalaGuyanaHaitiHondurasHong KongHungaryIndiaIndonesiaIranIraqIrelandIsraelItalyJamaicaJapanJordanKazakhstanKenyaKoreaKuwaitLaosLatin AmericaLatviaLebanonLiberiaLithuaniaMalaysiaMexicoMicronesiaMiddle AfricaMoldovaMoroccoNepalNetherlandsNicaraguaNigeriaNorth AmericaNorth MacedoniaNorthern AfricaNorthern EuropeNorwayOceaniaPakistanPanamaPeruPhilippinesPolandPortugalRomaniaRussiaSaudi ArabiaScotlandSenegalSerbiaSierra LeoneSingaporeSomaliaSouth AfricaSouth AmericaSouth Central AsiaSouth Eastern AsiaSouthern EuropeSpainSri LankaSt. Vincent and the GrenadinesSudanSwedenSwitzerlandSyriaTaiwanThailandTrinidad and TobagoTurkeyUgandaUkraineUruguayUzbekistanVenezuelaVietnamWest IndiesWestern AfricaWestern AsiaWestern EuropeYemenZaireZimbabweAzores
Child Poverty Under the Age of 5
Income
Poverty
Unemployment
Labor Participation
Family Structure
Vehicle Availability
Education Level
Disability

Child Poverty Under the Age of 5 Comparison

Houma

South Africans

Tragic
Exceptional
22.7%
CHILD POVERTY UNDER THE AGE OF 5
0.0/ 100
METRIC RATING
309th/ 347
METRIC RANK
16.2%
CHILD POVERTY UNDER THE AGE OF 5
90.1/ 100
METRIC RATING
128th/ 347
METRIC RANK

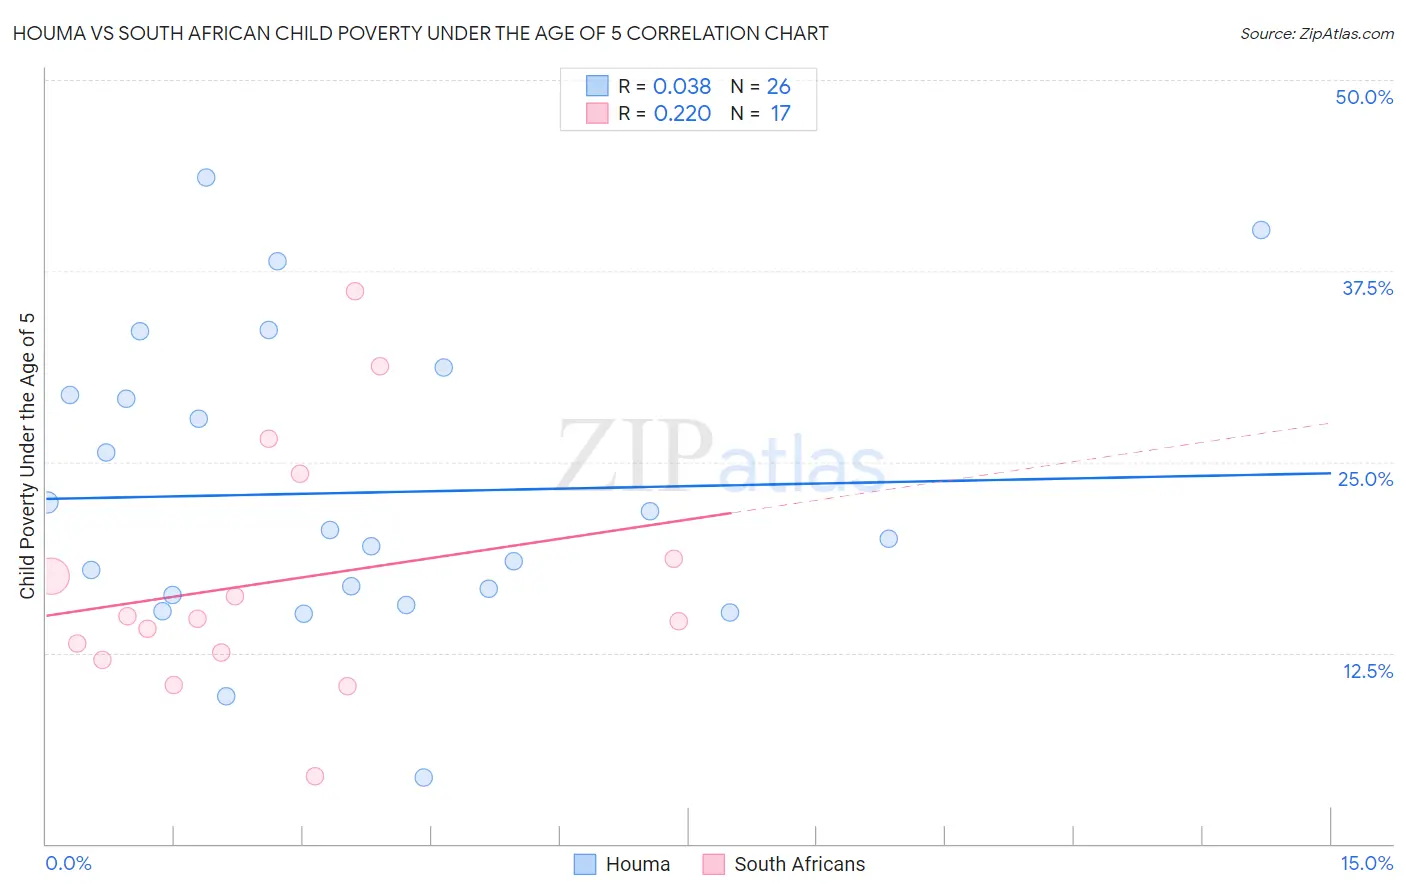
Houma vs South African Child Poverty Under the Age of 5 Correlation Chart

The statistical analysis conducted on geographies consisting of 36,619,572 people shows no correlation between the proportion of Houma and poverty level among children under the age of 5 in the United States with a correlation coefficient (R) of 0.038 and weighted average of 22.7%. Similarly, the statistical analysis conducted on geographies consisting of 177,239,967 people shows a weak positive correlation between the proportion of South Africans and poverty level among children under the age of 5 in the United States with a correlation coefficient (R) of 0.220 and weighted average of 16.2%, a difference of 39.9%.
Houma vs South African Child Poverty Under the Age of 5

Child Poverty Under the Age of 5 Correlation Summary

MeasurementHoumaSouth African
Minimum4.3%4.4%
Maximum43.6%36.2%
Range39.3%31.8%
Mean23.0%17.2%
Median20.3%14.7%
Interquartile 25% (IQ1)16.3%12.3%
Interquartile 75% (IQ3)29.4%21.4%
Interquartile Range (IQR)13.1%9.1%
Standard Deviation (Sample)9.6%8.1%
Standard Deviation (Population)9.4%7.8%

Similar Demographics by Child Poverty Under the Age of 5

Demographics Similar to Houma by Child Poverty Under the Age of 5

In terms of child poverty under the age of 5, the demographic groups most similar to Houma are Immigrants from Dominica (22.7%, a difference of 0.14%), Immigrants from Bahamas (22.7%, a difference of 0.18%), African (22.8%, a difference of 0.41%), Seminole (22.8%, a difference of 0.45%), and Honduran (23.0%, a difference of 1.1%).
DemographicsRating | RankChild Poverty Under the Age of 5
Iroquois
0.0
/100
|
#302
Tragic
22.0%
Inupiat
0.0
/100
|
#303
Tragic
22.0%
Immigrants | Guatemala
0.0
/100
|
#304
Tragic
22.0%
Immigrants | Mexico
0.0
/100
|
#305
Tragic
22.2%
Indonesians
0.0
/100
|
#306
Tragic
22.3%
Immigrants | Bahamas
0.0
/100
|
#307
Tragic
22.7%
Immigrants | Dominica
0.0
/100
|
#308
Tragic
22.7%
Houma
0.0
/100
|
#309
Tragic
22.7%
Africans
0.0
/100
|
#310
Tragic
22.8%
Seminole
0.0
/100
|
#311
Tragic
22.8%
Hondurans
0.0
/100
|
#312
Tragic
23.0%
Bahamians
0.0
/100
|
#313
Tragic
23.0%
U.S. Virgin Islanders
0.0
/100
|
#314
Tragic
23.0%
Arapaho
0.0
/100
|
#315
Tragic
23.1%
Yakama
0.0
/100
|
#316
Tragic
23.1%

Demographics Similar to South Africans by Child Poverty Under the Age of 5

In terms of child poverty under the age of 5, the demographic groups most similar to South Africans are British (16.3%, a difference of 0.18%), Immigrants from Norway (16.3%, a difference of 0.21%), Immigrants from England (16.2%, a difference of 0.49%), Finnish (16.3%, a difference of 0.51%), and Serbian (16.3%, a difference of 0.54%).
DemographicsRating | RankChild Poverty Under the Age of 5
Mongolians
92.5
/100
|
#121
Exceptional
16.1%
Immigrants | Southern Europe
92.0
/100
|
#122
Exceptional
16.1%
Austrians
92.0
/100
|
#123
Exceptional
16.1%
Swiss
92.0
/100
|
#124
Exceptional
16.1%
Native Hawaiians
91.8
/100
|
#125
Exceptional
16.2%
Immigrants | Albania
91.8
/100
|
#126
Exceptional
16.2%
Immigrants | England
91.5
/100
|
#127
Exceptional
16.2%
South Africans
90.1
/100
|
#128
Exceptional
16.2%
British
89.4
/100
|
#129
Excellent
16.3%
Immigrants | Norway
89.3
/100
|
#130
Excellent
16.3%
Finns
88.3
/100
|
#131
Excellent
16.3%
Serbians
88.2
/100
|
#132
Excellent
16.3%
Icelanders
87.9
/100
|
#133
Excellent
16.3%
Immigrants | North Macedonia
87.8
/100
|
#134
Excellent
16.4%
Brazilians
87.8
/100
|
#135
Excellent
16.4%