Honduran vs Immigrants from Western Europe Single Mother Poverty
COMPARE
Honduran
Immigrants from Western Europe
Single Mother Poverty
Single Mother Poverty Comparison
Hondurans
Immigrants from Western Europe
34.2%
SINGLE MOTHER POVERTY
0.0/ 100
METRIC RATING
310th/ 347
METRIC RANK
28.9%
SINGLE MOTHER POVERTY
71.1/ 100
METRIC RATING
157th/ 347
METRIC RANK
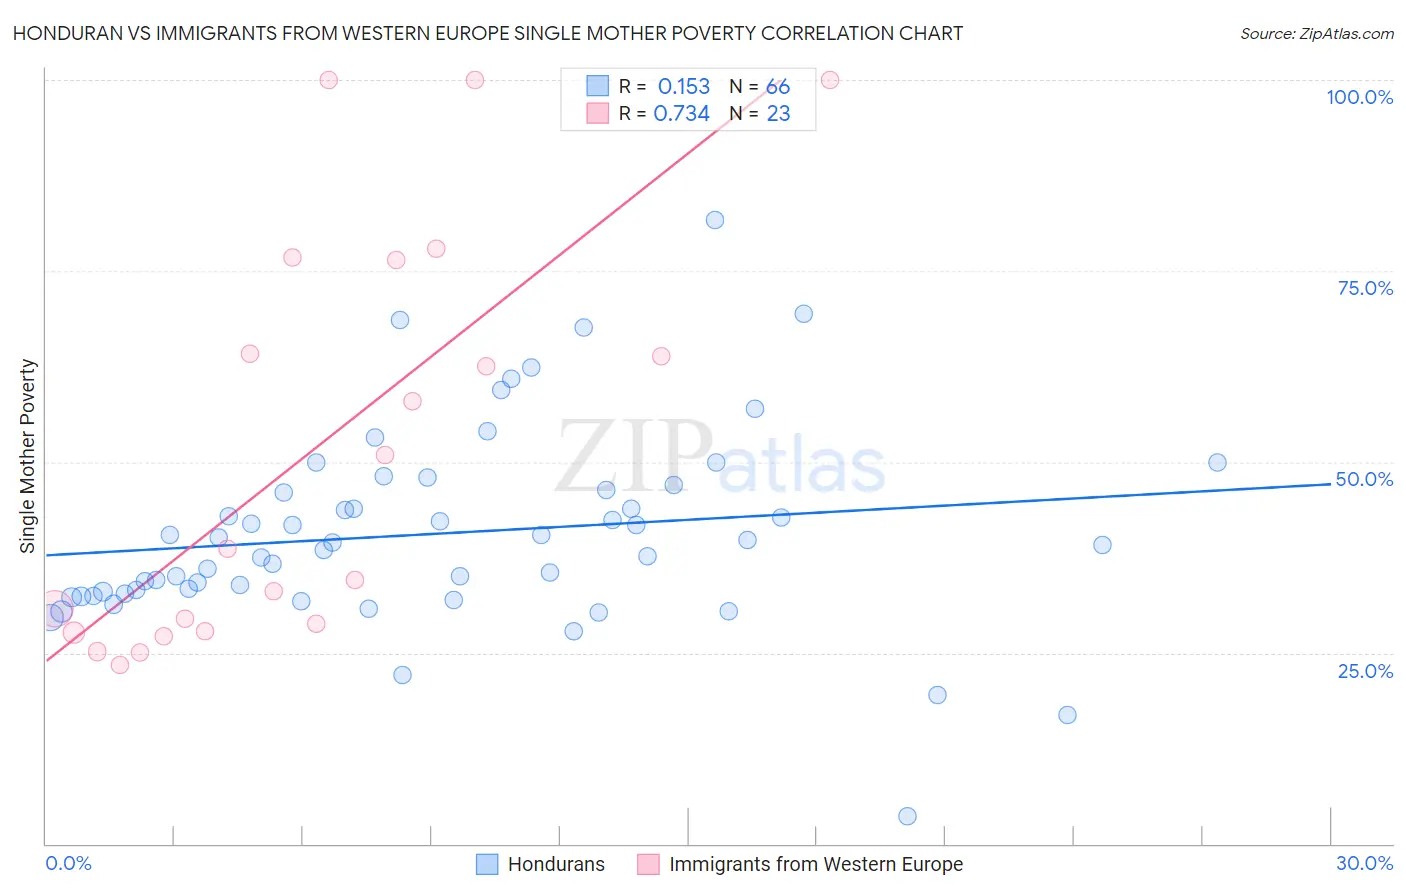
Honduran vs Immigrants from Western Europe Single Mother Poverty Correlation Chart
The statistical analysis conducted on geographies consisting of 352,983,929 people shows a poor positive correlation between the proportion of Hondurans and poverty level among single mothers in the United States with a correlation coefficient (R) of 0.153 and weighted average of 34.2%. Similarly, the statistical analysis conducted on geographies consisting of 476,604,717 people shows a strong positive correlation between the proportion of Immigrants from Western Europe and poverty level among single mothers in the United States with a correlation coefficient (R) of 0.734 and weighted average of 28.9%, a difference of 18.5%.
Single Mother Poverty Correlation Summary
| Measurement | Honduran | Immigrants from Western Europe |
| Minimum | 3.6% | 23.4% |
| Maximum | 81.7% | 100.0% |
| Range | 78.2% | 76.6% |
| Mean | 40.6% | 51.4% |
| Median | 39.2% | 38.6% |
| Interquartile 25% (IQ1) | 32.8% | 27.9% |
| Interquartile 75% (IQ3) | 46.3% | 76.4% |
| Interquartile Range (IQR) | 13.5% | 48.5% |
| Standard Deviation (Sample) | 12.9% | 26.6% |
| Standard Deviation (Population) | 12.8% | 26.1% |
Similar Demographics by Single Mother Poverty
Demographics Similar to Hondurans by Single Mother Poverty
In terms of single mother poverty, the demographic groups most similar to Hondurans are Potawatomi (34.1%, a difference of 0.22%), Alsatian (34.3%, a difference of 0.31%), Central American Indian (34.3%, a difference of 0.39%), Immigrants from Dominican Republic (34.4%, a difference of 0.47%), and Immigrants from Mexico (34.0%, a difference of 0.64%).
| Demographics | Rating | Rank | Single Mother Poverty |
| Americans | 0.0 /100 | #303 | Tragic 33.5% |
| Mexicans | 0.0 /100 | #304 | Tragic 33.6% |
| Immigrants | Central America | 0.0 /100 | #305 | Tragic 33.6% |
| Immigrants | Congo | 0.0 /100 | #306 | Tragic 33.8% |
| Comanche | 0.0 /100 | #307 | Tragic 33.9% |
| Immigrants | Mexico | 0.0 /100 | #308 | Tragic 34.0% |
| Potawatomi | 0.0 /100 | #309 | Tragic 34.1% |
| Hondurans | 0.0 /100 | #310 | Tragic 34.2% |
| Alsatians | 0.0 /100 | #311 | Tragic 34.3% |
| Central American Indians | 0.0 /100 | #312 | Tragic 34.3% |
| Immigrants | Dominican Republic | 0.0 /100 | #313 | Tragic 34.4% |
| Chickasaw | 0.0 /100 | #314 | Tragic 34.4% |
| Hopi | 0.0 /100 | #315 | Tragic 34.5% |
| Dominicans | 0.0 /100 | #316 | Tragic 34.5% |
| Cherokee | 0.0 /100 | #317 | Tragic 34.5% |
Demographics Similar to Immigrants from Western Europe by Single Mother Poverty
In terms of single mother poverty, the demographic groups most similar to Immigrants from Western Europe are Iraqi (28.8%, a difference of 0.030%), Immigrants from Hungary (28.9%, a difference of 0.030%), Ugandan (28.8%, a difference of 0.040%), Portuguese (28.8%, a difference of 0.13%), and Czech (28.9%, a difference of 0.15%).
| Demographics | Rating | Rank | Single Mother Poverty |
| Northern Europeans | 81.7 /100 | #150 | Excellent 28.6% |
| Immigrants | Oceania | 79.9 /100 | #151 | Good 28.7% |
| Austrians | 79.0 /100 | #152 | Good 28.7% |
| Slovenes | 76.4 /100 | #153 | Good 28.8% |
| Portuguese | 73.2 /100 | #154 | Good 28.8% |
| Ugandans | 71.7 /100 | #155 | Good 28.8% |
| Iraqis | 71.5 /100 | #156 | Good 28.8% |
| Immigrants | Western Europe | 71.1 /100 | #157 | Good 28.9% |
| Immigrants | Hungary | 70.6 /100 | #158 | Good 28.9% |
| Czechs | 68.4 /100 | #159 | Good 28.9% |
| Japanese | 68.0 /100 | #160 | Good 28.9% |
| Immigrants | Cambodia | 66.6 /100 | #161 | Good 28.9% |
| Scandinavians | 66.2 /100 | #162 | Good 28.9% |
| Immigrants | Nigeria | 65.9 /100 | #163 | Good 28.9% |
| Immigrants | Kenya | 65.9 /100 | #164 | Good 28.9% |