Honduran vs Immigrants from Germany Single Male Poverty
COMPARE
Honduran
Immigrants from Germany
Single Male Poverty
Single Male Poverty Comparison
Hondurans
Immigrants from Germany
14.0%
SINGLE MALE POVERTY
0.1/ 100
METRIC RATING
274th/ 347
METRIC RANK
13.4%
SINGLE MALE POVERTY
2.1/ 100
METRIC RATING
241st/ 347
METRIC RANK
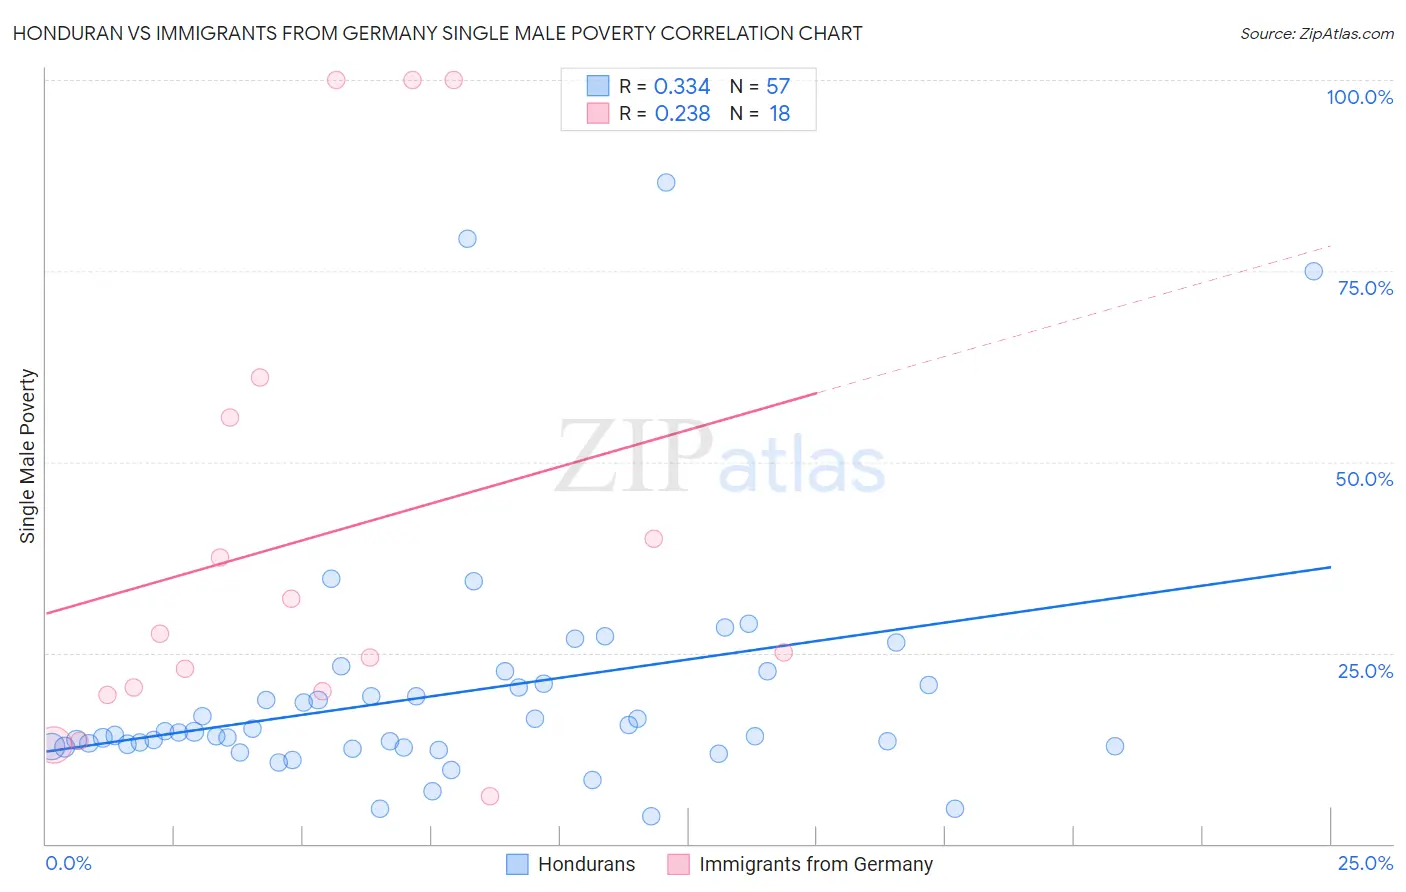
Honduran vs Immigrants from Germany Single Male Poverty Correlation Chart
The statistical analysis conducted on geographies consisting of 327,718,119 people shows a mild positive correlation between the proportion of Hondurans and poverty level among single males in the United States with a correlation coefficient (R) of 0.334 and weighted average of 14.0%. Similarly, the statistical analysis conducted on geographies consisting of 402,484,283 people shows a weak positive correlation between the proportion of Immigrants from Germany and poverty level among single males in the United States with a correlation coefficient (R) of 0.238 and weighted average of 13.4%, a difference of 4.5%.
Single Male Poverty Correlation Summary
| Measurement | Honduran | Immigrants from Germany |
| Minimum | 3.6% | 6.2% |
| Maximum | 86.6% | 100.0% |
| Range | 83.0% | 93.8% |
| Mean | 19.6% | 39.9% |
| Median | 14.6% | 26.2% |
| Interquartile 25% (IQ1) | 12.7% | 19.9% |
| Interquartile 75% (IQ3) | 20.9% | 55.8% |
| Interquartile Range (IQR) | 8.2% | 35.9% |
| Standard Deviation (Sample) | 15.9% | 30.9% |
| Standard Deviation (Population) | 15.8% | 30.1% |
Similar Demographics by Single Male Poverty
Demographics Similar to Hondurans by Single Male Poverty
In terms of single male poverty, the demographic groups most similar to Hondurans are English (14.1%, a difference of 0.080%), Welsh (14.0%, a difference of 0.13%), Dutch (14.1%, a difference of 0.19%), Immigrants from Honduras (14.1%, a difference of 0.23%), and Slovak (14.1%, a difference of 0.30%).
| Demographics | Rating | Rank | Single Male Poverty |
| Germans | 0.1 /100 | #267 | Tragic 13.9% |
| Immigrants | Mexico | 0.1 /100 | #268 | Tragic 13.9% |
| Scottish | 0.1 /100 | #269 | Tragic 14.0% |
| Immigrants | Saudi Arabia | 0.1 /100 | #270 | Tragic 14.0% |
| Irish | 0.1 /100 | #271 | Tragic 14.0% |
| Mexicans | 0.1 /100 | #272 | Tragic 14.0% |
| Welsh | 0.1 /100 | #273 | Tragic 14.0% |
| Hondurans | 0.1 /100 | #274 | Tragic 14.0% |
| English | 0.1 /100 | #275 | Tragic 14.1% |
| Dutch | 0.1 /100 | #276 | Tragic 14.1% |
| Immigrants | Honduras | 0.0 /100 | #277 | Tragic 14.1% |
| Slovaks | 0.0 /100 | #278 | Tragic 14.1% |
| Indonesians | 0.0 /100 | #279 | Tragic 14.1% |
| Hmong | 0.0 /100 | #280 | Tragic 14.2% |
| Hispanics or Latinos | 0.0 /100 | #281 | Tragic 14.2% |
Demographics Similar to Immigrants from Germany by Single Male Poverty
In terms of single male poverty, the demographic groups most similar to Immigrants from Germany are Carpatho Rusyn (13.4%, a difference of 0.010%), Barbadian (13.4%, a difference of 0.060%), Belizean (13.4%, a difference of 0.11%), Immigrants from Senegal (13.5%, a difference of 0.33%), and Czechoslovakian (13.4%, a difference of 0.42%).
| Demographics | Rating | Rank | Single Male Poverty |
| Canadians | 4.0 /100 | #234 | Tragic 13.3% |
| Bangladeshis | 3.7 /100 | #235 | Tragic 13.3% |
| Luxembourgers | 3.6 /100 | #236 | Tragic 13.4% |
| British West Indians | 3.4 /100 | #237 | Tragic 13.4% |
| Immigrants | Ghana | 3.2 /100 | #238 | Tragic 13.4% |
| Czechoslovakians | 3.0 /100 | #239 | Tragic 13.4% |
| Belizeans | 2.3 /100 | #240 | Tragic 13.4% |
| Immigrants | Germany | 2.1 /100 | #241 | Tragic 13.4% |
| Carpatho Rusyns | 2.1 /100 | #242 | Tragic 13.4% |
| Barbadians | 2.1 /100 | #243 | Tragic 13.4% |
| Immigrants | Senegal | 1.7 /100 | #244 | Tragic 13.5% |
| Immigrants | Latin America | 1.3 /100 | #245 | Tragic 13.5% |
| Immigrants | Micronesia | 1.2 /100 | #246 | Tragic 13.5% |
| Belgians | 1.2 /100 | #247 | Tragic 13.5% |
| Czechs | 1.2 /100 | #248 | Tragic 13.5% |