Honduran vs Immigrants from Costa Rica Seniors Poverty Over the Age of 75
COMPARE
Honduran
Immigrants from Costa Rica
Seniors Poverty Over the Age of 75
Seniors Poverty Over the Age of 75 Comparison
Hondurans
Immigrants from Costa Rica
15.4%
SENIORS POVERTY OVER THE AGE OF 75
0.0/ 100
METRIC RATING
297th/ 347
METRIC RANK
13.3%
SENIORS POVERTY OVER THE AGE OF 75
1.3/ 100
METRIC RATING
233rd/ 347
METRIC RANK
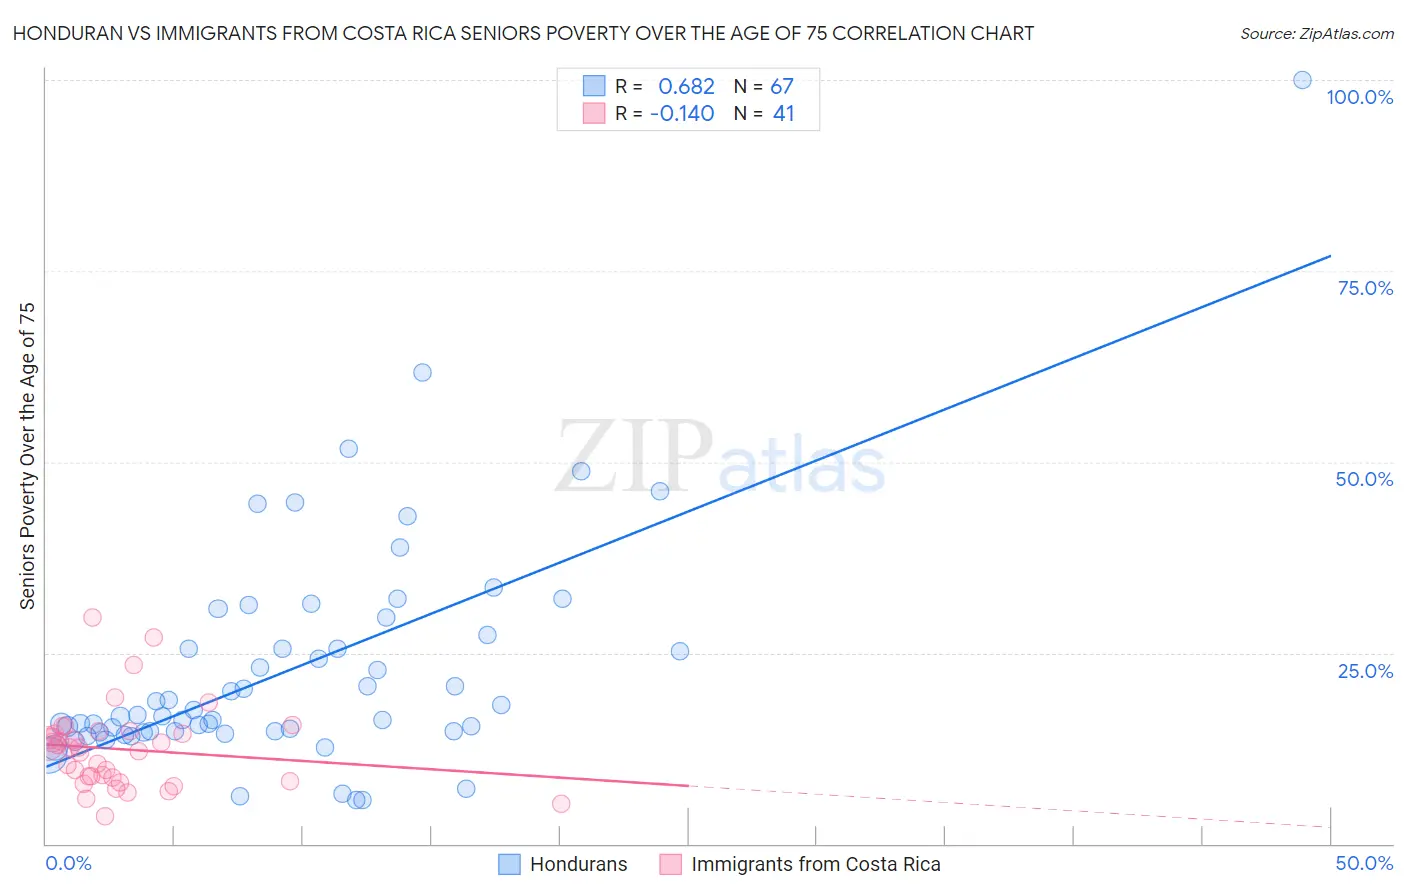
Honduran vs Immigrants from Costa Rica Seniors Poverty Over the Age of 75 Correlation Chart
The statistical analysis conducted on geographies consisting of 354,613,309 people shows a significant positive correlation between the proportion of Hondurans and poverty level among seniors over the age of 75 in the United States with a correlation coefficient (R) of 0.682 and weighted average of 15.4%. Similarly, the statistical analysis conducted on geographies consisting of 203,329,700 people shows a poor negative correlation between the proportion of Immigrants from Costa Rica and poverty level among seniors over the age of 75 in the United States with a correlation coefficient (R) of -0.140 and weighted average of 13.3%, a difference of 16.5%.
Seniors Poverty Over the Age of 75 Correlation Summary
| Measurement | Honduran | Immigrants from Costa Rica |
| Minimum | 5.7% | 3.5% |
| Maximum | 100.0% | 29.6% |
| Range | 94.3% | 26.0% |
| Mean | 22.9% | 12.4% |
| Median | 16.7% | 12.6% |
| Interquartile 25% (IQ1) | 14.7% | 8.4% |
| Interquartile 75% (IQ3) | 27.3% | 14.6% |
| Interquartile Range (IQR) | 12.6% | 6.2% |
| Standard Deviation (Sample) | 15.1% | 5.4% |
| Standard Deviation (Population) | 15.0% | 5.4% |
Similar Demographics by Seniors Poverty Over the Age of 75
Demographics Similar to Hondurans by Seniors Poverty Over the Age of 75
In terms of seniors poverty over the age of 75, the demographic groups most similar to Hondurans are Yuman (15.4%, a difference of 0.28%), Native/Alaskan (15.5%, a difference of 0.34%), Spanish American Indian (15.5%, a difference of 0.44%), Bahamian (15.5%, a difference of 0.45%), and U.S. Virgin Islander (15.4%, a difference of 0.46%).
| Demographics | Rating | Rank | Seniors Poverty Over the Age of 75 |
| Immigrants | Azores | 0.0 /100 | #290 | Tragic 15.2% |
| Paiute | 0.0 /100 | #291 | Tragic 15.2% |
| Colville | 0.0 /100 | #292 | Tragic 15.2% |
| Apache | 0.0 /100 | #293 | Tragic 15.3% |
| Immigrants | Jamaica | 0.0 /100 | #294 | Tragic 15.3% |
| U.S. Virgin Islanders | 0.0 /100 | #295 | Tragic 15.4% |
| Yuman | 0.0 /100 | #296 | Tragic 15.4% |
| Hondurans | 0.0 /100 | #297 | Tragic 15.4% |
| Natives/Alaskans | 0.0 /100 | #298 | Tragic 15.5% |
| Spanish American Indians | 0.0 /100 | #299 | Tragic 15.5% |
| Bahamians | 0.0 /100 | #300 | Tragic 15.5% |
| Immigrants | Latin America | 0.0 /100 | #301 | Tragic 15.6% |
| West Indians | 0.0 /100 | #302 | Tragic 15.7% |
| Immigrants | Honduras | 0.0 /100 | #303 | Tragic 15.7% |
| Immigrants | Trinidad and Tobago | 0.0 /100 | #304 | Tragic 15.7% |
Demographics Similar to Immigrants from Costa Rica by Seniors Poverty Over the Age of 75
In terms of seniors poverty over the age of 75, the demographic groups most similar to Immigrants from Costa Rica are Immigrants from Chile (13.3%, a difference of 0.030%), Subsaharan African (13.2%, a difference of 0.23%), Immigrants from China (13.2%, a difference of 0.24%), Somali (13.2%, a difference of 0.33%), and Immigrants from Israel (13.3%, a difference of 0.35%).
| Demographics | Rating | Rank | Seniors Poverty Over the Age of 75 |
| Shoshone | 2.6 /100 | #226 | Tragic 13.1% |
| Cree | 2.3 /100 | #227 | Tragic 13.1% |
| Israelis | 2.0 /100 | #228 | Tragic 13.2% |
| Somalis | 1.6 /100 | #229 | Tragic 13.2% |
| Immigrants | China | 1.5 /100 | #230 | Tragic 13.2% |
| Sub-Saharan Africans | 1.5 /100 | #231 | Tragic 13.2% |
| Immigrants | Chile | 1.3 /100 | #232 | Tragic 13.3% |
| Immigrants | Costa Rica | 1.3 /100 | #233 | Tragic 13.3% |
| Immigrants | Israel | 1.1 /100 | #234 | Tragic 13.3% |
| Japanese | 0.9 /100 | #235 | Tragic 13.3% |
| Moroccans | 0.9 /100 | #236 | Tragic 13.3% |
| Alaskan Athabascans | 0.8 /100 | #237 | Tragic 13.4% |
| Peruvians | 0.8 /100 | #238 | Tragic 13.4% |
| Panamanians | 0.8 /100 | #239 | Tragic 13.4% |
| Argentineans | 0.7 /100 | #240 | Tragic 13.4% |