Honduran vs Cree Female Poverty
COMPARE
Honduran
Cree
Female Poverty
Female Poverty Comparison
Hondurans
Cree
17.4%
FEMALE POVERTY
0.0/ 100
METRIC RATING
316th/ 347
METRIC RANK
15.1%
FEMALE POVERTY
0.7/ 100
METRIC RATING
236th/ 347
METRIC RANK
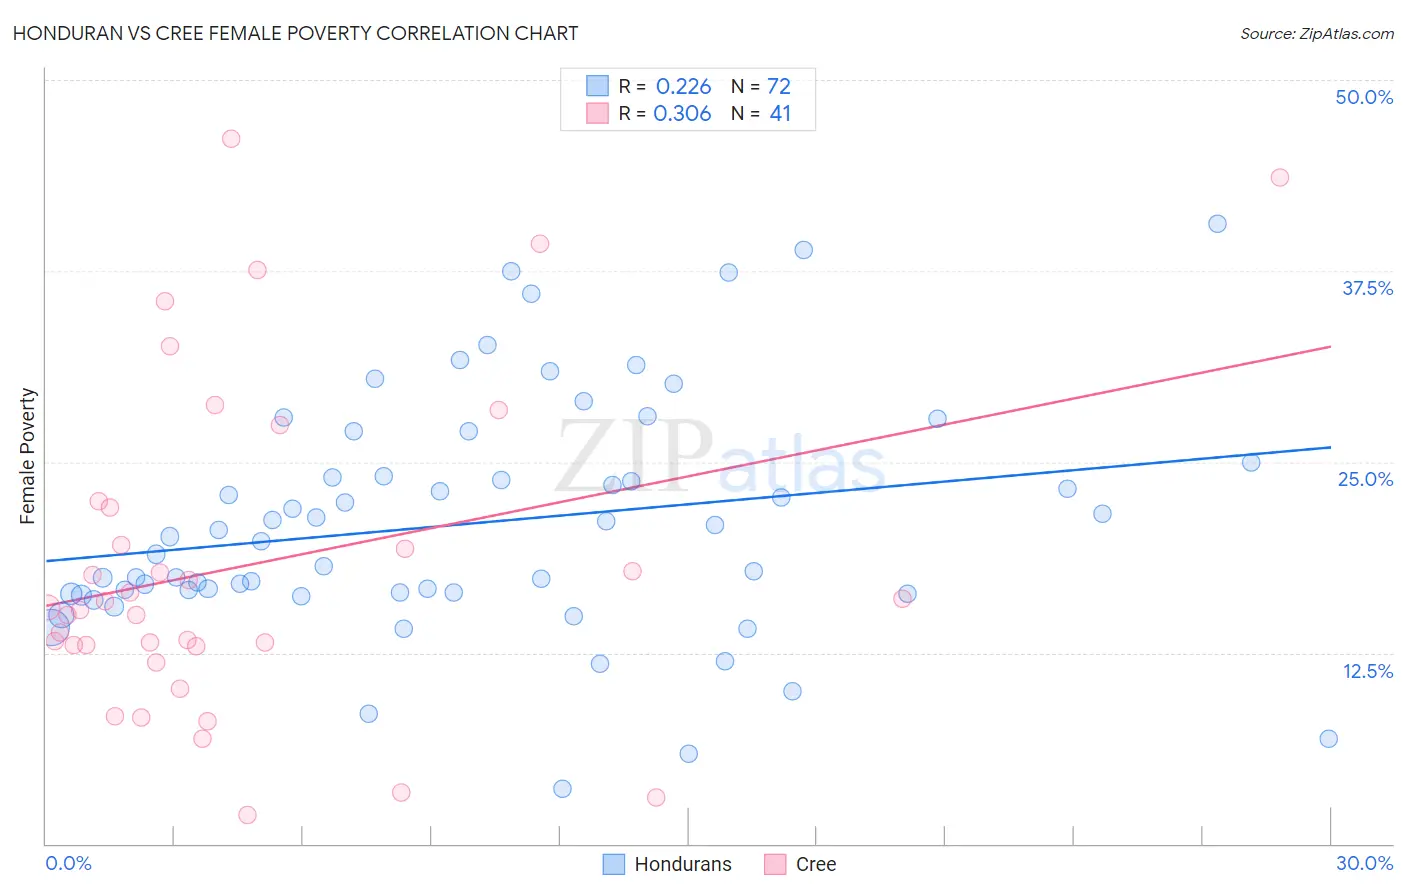
Honduran vs Cree Female Poverty Correlation Chart
The statistical analysis conducted on geographies consisting of 357,544,045 people shows a weak positive correlation between the proportion of Hondurans and poverty level among females in the United States with a correlation coefficient (R) of 0.226 and weighted average of 17.4%. Similarly, the statistical analysis conducted on geographies consisting of 76,205,859 people shows a mild positive correlation between the proportion of Cree and poverty level among females in the United States with a correlation coefficient (R) of 0.306 and weighted average of 15.1%, a difference of 15.3%.
Female Poverty Correlation Summary
| Measurement | Honduran | Cree |
| Minimum | 3.6% | 1.9% |
| Maximum | 40.6% | 46.1% |
| Range | 37.0% | 44.3% |
| Mean | 21.0% | 18.3% |
| Median | 20.0% | 15.5% |
| Interquartile 25% (IQ1) | 16.4% | 13.0% |
| Interquartile 75% (IQ3) | 24.5% | 22.2% |
| Interquartile Range (IQR) | 8.1% | 9.2% |
| Standard Deviation (Sample) | 7.7% | 10.7% |
| Standard Deviation (Population) | 7.7% | 10.6% |
Similar Demographics by Female Poverty
Demographics Similar to Hondurans by Female Poverty
In terms of female poverty, the demographic groups most similar to Hondurans are Immigrants from Congo (17.4%, a difference of 0.19%), U.S. Virgin Islander (17.3%, a difference of 0.30%), Ute (17.5%, a difference of 0.52%), Cajun (17.5%, a difference of 0.53%), and Immigrants from Dominica (17.5%, a difference of 0.61%).
| Demographics | Rating | Rank | Female Poverty |
| Immigrants | Mexico | 0.0 /100 | #309 | Tragic 17.0% |
| Creek | 0.0 /100 | #310 | Tragic 17.0% |
| Immigrants | Guatemala | 0.0 /100 | #311 | Tragic 17.0% |
| Immigrants | Somalia | 0.0 /100 | #312 | Tragic 17.0% |
| British West Indians | 0.0 /100 | #313 | Tragic 17.0% |
| Dutch West Indians | 0.0 /100 | #314 | Tragic 17.1% |
| U.S. Virgin Islanders | 0.0 /100 | #315 | Tragic 17.3% |
| Hondurans | 0.0 /100 | #316 | Tragic 17.4% |
| Immigrants | Congo | 0.0 /100 | #317 | Tragic 17.4% |
| Ute | 0.0 /100 | #318 | Tragic 17.5% |
| Cajuns | 0.0 /100 | #319 | Tragic 17.5% |
| Immigrants | Dominica | 0.0 /100 | #320 | Tragic 17.5% |
| Arapaho | 0.0 /100 | #321 | Tragic 17.5% |
| Menominee | 0.0 /100 | #322 | Tragic 17.6% |
| Paiute | 0.0 /100 | #323 | Tragic 17.7% |
Demographics Similar to Cree by Female Poverty
In terms of female poverty, the demographic groups most similar to Cree are French American Indian (15.1%, a difference of 0.19%), Immigrants from Armenia (15.1%, a difference of 0.26%), Immigrants from Laos (15.0%, a difference of 0.63%), Immigrants from Middle Africa (15.2%, a difference of 0.78%), and Sudanese (15.2%, a difference of 0.84%).
| Demographics | Rating | Rank | Female Poverty |
| Ghanaians | 1.9 /100 | #229 | Tragic 14.7% |
| Alaska Natives | 1.8 /100 | #230 | Tragic 14.7% |
| Nigerians | 1.7 /100 | #231 | Tragic 14.8% |
| Osage | 1.5 /100 | #232 | Tragic 14.8% |
| Immigrants | Saudi Arabia | 1.4 /100 | #233 | Tragic 14.8% |
| Fijians | 1.1 /100 | #234 | Tragic 14.9% |
| Immigrants | Laos | 0.9 /100 | #235 | Tragic 15.0% |
| Cree | 0.7 /100 | #236 | Tragic 15.1% |
| French American Indians | 0.6 /100 | #237 | Tragic 15.1% |
| Immigrants | Armenia | 0.6 /100 | #238 | Tragic 15.1% |
| Immigrants | Middle Africa | 0.5 /100 | #239 | Tragic 15.2% |
| Sudanese | 0.5 /100 | #240 | Tragic 15.2% |
| Immigrants | Sudan | 0.4 /100 | #241 | Tragic 15.2% |
| Nepalese | 0.4 /100 | #242 | Tragic 15.2% |
| Nicaraguans | 0.3 /100 | #243 | Tragic 15.3% |