Hmong vs Inupiat Single Male Poverty
COMPARE
Hmong
Inupiat
Single Male Poverty
Single Male Poverty Comparison
Hmong
Inupiat
14.2%
SINGLE MALE POVERTY
0.0/ 100
METRIC RATING
280th/ 347
METRIC RANK
20.0%
SINGLE MALE POVERTY
0.0/ 100
METRIC RATING
333rd/ 347
METRIC RANK
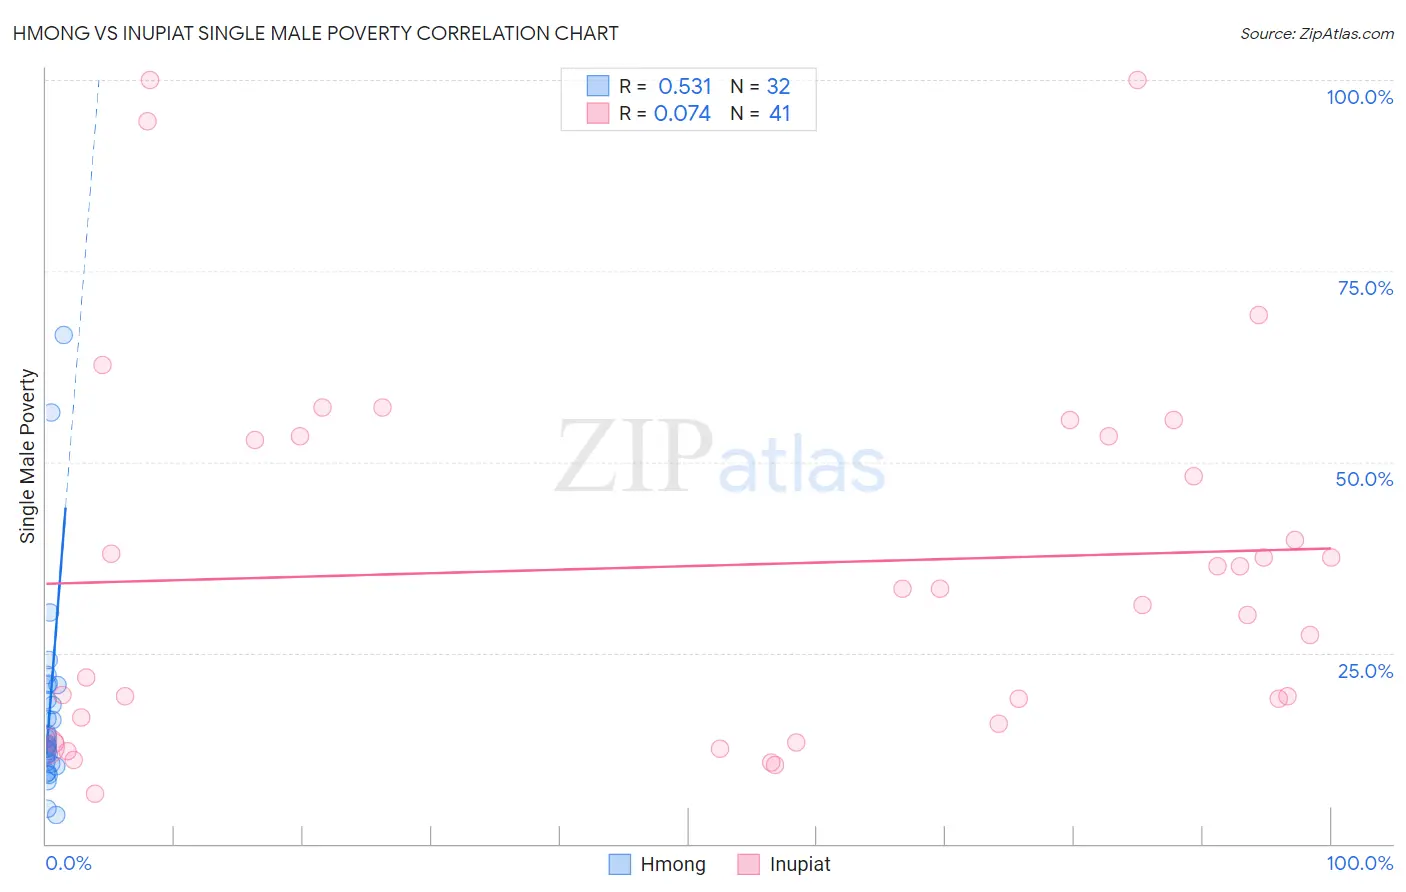
Hmong vs Inupiat Single Male Poverty Correlation Chart
The statistical analysis conducted on geographies consisting of 24,410,058 people shows a substantial positive correlation between the proportion of Hmong and poverty level among single males in the United States with a correlation coefficient (R) of 0.531 and weighted average of 14.2%. Similarly, the statistical analysis conducted on geographies consisting of 93,554,052 people shows a slight positive correlation between the proportion of Inupiat and poverty level among single males in the United States with a correlation coefficient (R) of 0.074 and weighted average of 20.0%, a difference of 40.8%.
Single Male Poverty Correlation Summary
| Measurement | Hmong | Inupiat |
| Minimum | 3.8% | 6.5% |
| Maximum | 66.7% | 100.0% |
| Range | 62.9% | 93.5% |
| Mean | 17.1% | 36.4% |
| Median | 13.0% | 33.3% |
| Interquartile 25% (IQ1) | 10.6% | 16.1% |
| Interquartile 75% (IQ3) | 19.8% | 53.3% |
| Interquartile Range (IQR) | 9.2% | 37.2% |
| Standard Deviation (Sample) | 13.0% | 24.6% |
| Standard Deviation (Population) | 12.8% | 24.3% |
Similar Demographics by Single Male Poverty
Demographics Similar to Hmong by Single Male Poverty
In terms of single male poverty, the demographic groups most similar to Hmong are Hispanic or Latino (14.2%, a difference of 0.030%), Spanish American (14.2%, a difference of 0.18%), Yaqui (14.2%, a difference of 0.34%), Indonesian (14.1%, a difference of 0.70%), and Slovak (14.1%, a difference of 0.74%).
| Demographics | Rating | Rank | Single Male Poverty |
| Welsh | 0.1 /100 | #273 | Tragic 14.0% |
| Hondurans | 0.1 /100 | #274 | Tragic 14.0% |
| English | 0.1 /100 | #275 | Tragic 14.1% |
| Dutch | 0.1 /100 | #276 | Tragic 14.1% |
| Immigrants | Honduras | 0.0 /100 | #277 | Tragic 14.1% |
| Slovaks | 0.0 /100 | #278 | Tragic 14.1% |
| Indonesians | 0.0 /100 | #279 | Tragic 14.1% |
| Hmong | 0.0 /100 | #280 | Tragic 14.2% |
| Hispanics or Latinos | 0.0 /100 | #281 | Tragic 14.2% |
| Spanish Americans | 0.0 /100 | #282 | Tragic 14.2% |
| Yaqui | 0.0 /100 | #283 | Tragic 14.2% |
| Immigrants | Bahamas | 0.0 /100 | #284 | Tragic 14.4% |
| French | 0.0 /100 | #285 | Tragic 14.4% |
| Celtics | 0.0 /100 | #286 | Tragic 14.5% |
| Iroquois | 0.0 /100 | #287 | Tragic 14.5% |
Demographics Similar to Inupiat by Single Male Poverty
In terms of single male poverty, the demographic groups most similar to Inupiat are Pima (20.2%, a difference of 0.80%), Native/Alaskan (19.6%, a difference of 1.9%), Paiute (19.3%, a difference of 3.6%), Cajun (19.1%, a difference of 4.8%), and Yuman (21.3%, a difference of 6.6%).
| Demographics | Rating | Rank | Single Male Poverty |
| Central American Indians | 0.0 /100 | #326 | Tragic 17.2% |
| Menominee | 0.0 /100 | #327 | Tragic 17.7% |
| Kiowa | 0.0 /100 | #328 | Tragic 18.3% |
| Colville | 0.0 /100 | #329 | Tragic 18.4% |
| Cajuns | 0.0 /100 | #330 | Tragic 19.1% |
| Paiute | 0.0 /100 | #331 | Tragic 19.3% |
| Natives/Alaskans | 0.0 /100 | #332 | Tragic 19.6% |
| Inupiat | 0.0 /100 | #333 | Tragic 20.0% |
| Pima | 0.0 /100 | #334 | Tragic 20.2% |
| Yuman | 0.0 /100 | #335 | Tragic 21.3% |
| Tohono O'odham | 0.0 /100 | #336 | Tragic 21.6% |
| Apache | 0.0 /100 | #337 | Tragic 21.6% |
| Pueblo | 0.0 /100 | #338 | Tragic 21.6% |
| Arapaho | 0.0 /100 | #339 | Tragic 21.9% |
| Sioux | 0.0 /100 | #340 | Tragic 22.2% |