Hawaiian vs Immigrants from Malaysia Female Poverty
COMPARE
Hawaiian
Immigrants from Malaysia
Female Poverty
Female Poverty Comparison
Hawaiians
Immigrants from Malaysia
13.6%
FEMALE POVERTY
39.9/ 100
METRIC RATING
188th/ 347
METRIC RANK
13.0%
FEMALE POVERTY
80.4/ 100
METRIC RATING
143rd/ 347
METRIC RANK
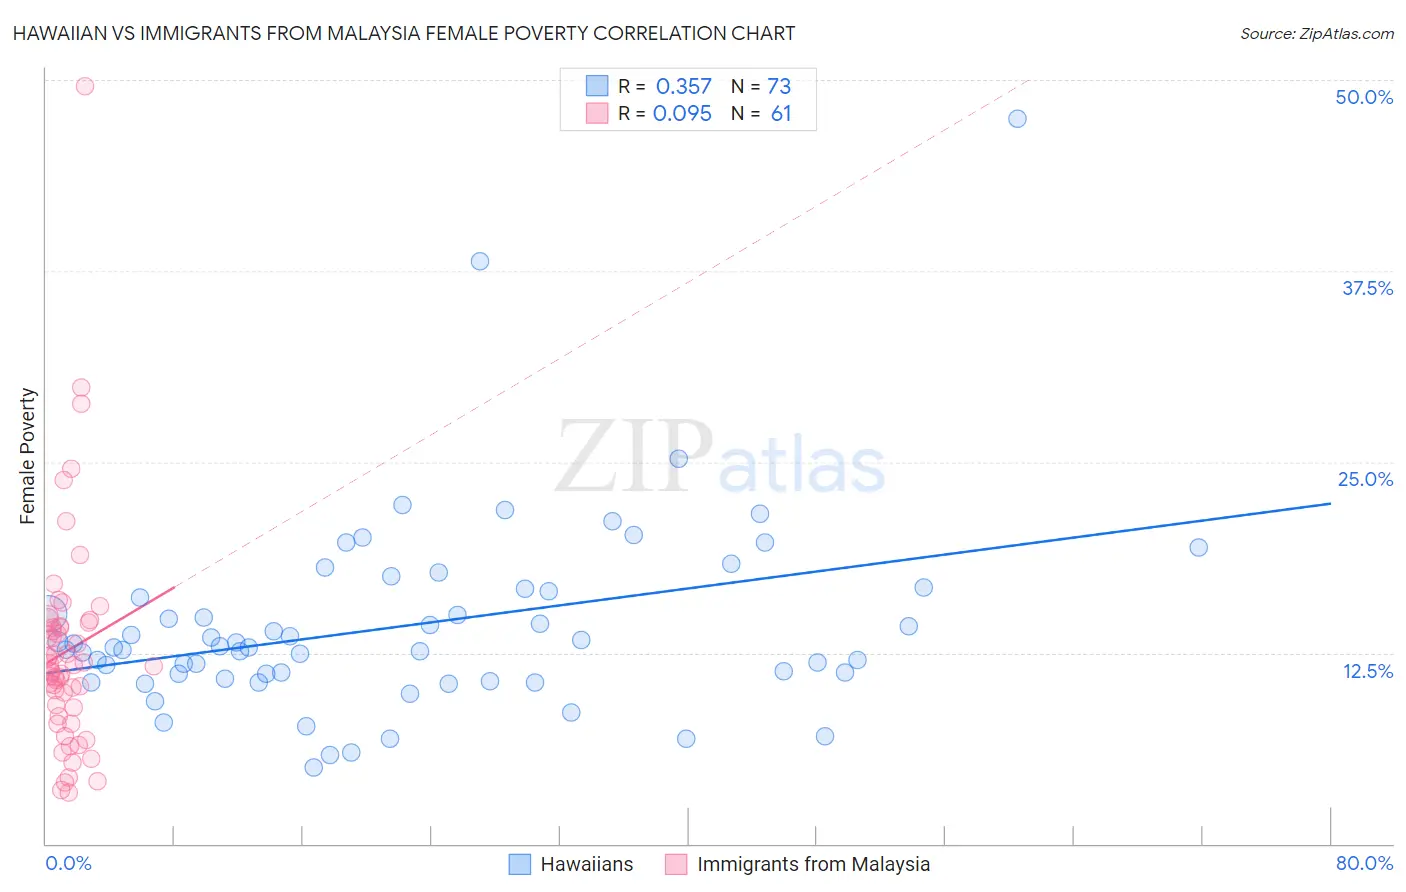
Hawaiian vs Immigrants from Malaysia Female Poverty Correlation Chart
The statistical analysis conducted on geographies consisting of 327,347,433 people shows a mild positive correlation between the proportion of Hawaiians and poverty level among females in the United States with a correlation coefficient (R) of 0.357 and weighted average of 13.6%. Similarly, the statistical analysis conducted on geographies consisting of 197,903,089 people shows a slight positive correlation between the proportion of Immigrants from Malaysia and poverty level among females in the United States with a correlation coefficient (R) of 0.095 and weighted average of 13.0%, a difference of 4.5%.
Female Poverty Correlation Summary
| Measurement | Hawaiian | Immigrants from Malaysia |
| Minimum | 5.0% | 3.4% |
| Maximum | 47.5% | 49.6% |
| Range | 42.5% | 46.2% |
| Mean | 14.3% | 12.6% |
| Median | 12.9% | 11.6% |
| Interquartile 25% (IQ1) | 11.0% | 8.6% |
| Interquartile 75% (IQ3) | 16.6% | 14.3% |
| Interquartile Range (IQR) | 5.7% | 5.7% |
| Standard Deviation (Sample) | 6.5% | 7.3% |
| Standard Deviation (Population) | 6.4% | 7.2% |
Similar Demographics by Female Poverty
Demographics Similar to Hawaiians by Female Poverty
In terms of female poverty, the demographic groups most similar to Hawaiians are Uruguayan (13.6%, a difference of 0.010%), Immigrants from Venezuela (13.6%, a difference of 0.11%), Immigrants from Portugal (13.6%, a difference of 0.16%), Immigrants from Cameroon (13.5%, a difference of 0.21%), and Immigrants from Sierra Leone (13.5%, a difference of 0.32%).
| Demographics | Rating | Rank | Female Poverty |
| Venezuelans | 44.5 /100 | #181 | Average 13.5% |
| Immigrants | Colombia | 44.5 /100 | #182 | Average 13.5% |
| Kenyans | 43.8 /100 | #183 | Average 13.5% |
| Immigrants | Sierra Leone | 43.2 /100 | #184 | Average 13.5% |
| Immigrants | Cameroon | 42.0 /100 | #185 | Average 13.5% |
| Immigrants | Portugal | 41.5 /100 | #186 | Average 13.6% |
| Immigrants | Venezuela | 41.0 /100 | #187 | Average 13.6% |
| Hawaiians | 39.9 /100 | #188 | Fair 13.6% |
| Uruguayans | 39.8 /100 | #189 | Fair 13.6% |
| Sierra Leoneans | 33.1 /100 | #190 | Fair 13.7% |
| Immigrants | Kuwait | 32.7 /100 | #191 | Fair 13.7% |
| Immigrants | Costa Rica | 31.9 /100 | #192 | Fair 13.7% |
| Iraqis | 31.8 /100 | #193 | Fair 13.7% |
| Delaware | 31.1 /100 | #194 | Fair 13.7% |
| Immigrants | South America | 30.6 /100 | #195 | Fair 13.7% |
Demographics Similar to Immigrants from Malaysia by Female Poverty
In terms of female poverty, the demographic groups most similar to Immigrants from Malaysia are Brazilian (13.0%, a difference of 0.020%), Afghan (13.0%, a difference of 0.090%), Icelander (13.0%, a difference of 0.12%), Syrian (13.0%, a difference of 0.12%), and Immigrants from Peru (13.0%, a difference of 0.19%).
| Demographics | Rating | Rank | Female Poverty |
| Peruvians | 85.2 /100 | #136 | Excellent 12.9% |
| Chileans | 84.7 /100 | #137 | Excellent 12.9% |
| Immigrants | France | 83.6 /100 | #138 | Excellent 12.9% |
| Basques | 83.1 /100 | #139 | Excellent 12.9% |
| Pakistanis | 83.0 /100 | #140 | Excellent 12.9% |
| Icelanders | 81.1 /100 | #141 | Excellent 13.0% |
| Brazilians | 80.5 /100 | #142 | Excellent 13.0% |
| Immigrants | Malaysia | 80.4 /100 | #143 | Excellent 13.0% |
| Afghans | 79.8 /100 | #144 | Good 13.0% |
| Syrians | 79.6 /100 | #145 | Good 13.0% |
| Immigrants | Peru | 79.1 /100 | #146 | Good 13.0% |
| Immigrants | Kazakhstan | 78.6 /100 | #147 | Good 13.0% |
| Yugoslavians | 76.9 /100 | #148 | Good 13.1% |
| Taiwanese | 75.7 /100 | #149 | Good 13.1% |
| Tsimshian | 75.5 /100 | #150 | Good 13.1% |