Hawaiian vs Dutch Seniors Poverty Over the Age of 75
COMPARE
Hawaiian
Dutch
Seniors Poverty Over the Age of 75
Seniors Poverty Over the Age of 75 Comparison
Hawaiians
Dutch
11.1%
SENIORS POVERTY OVER THE AGE OF 75
98.8/ 100
METRIC RATING
47th/ 347
METRIC RANK
10.5%
SENIORS POVERTY OVER THE AGE OF 75
99.9/ 100
METRIC RATING
16th/ 347
METRIC RANK
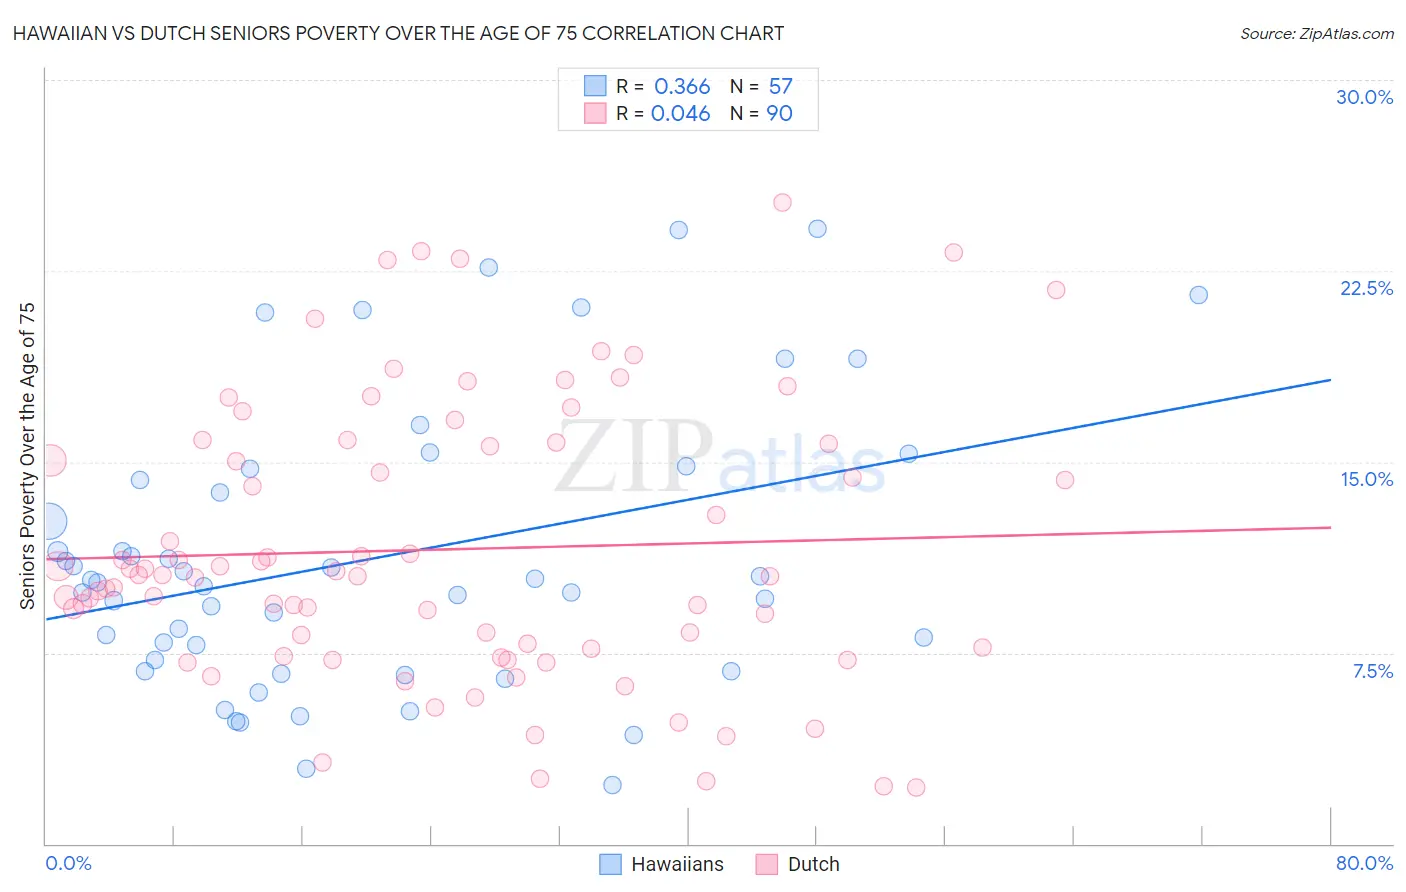
Hawaiian vs Dutch Seniors Poverty Over the Age of 75 Correlation Chart
The statistical analysis conducted on geographies consisting of 324,075,554 people shows a mild positive correlation between the proportion of Hawaiians and poverty level among seniors over the age of 75 in the United States with a correlation coefficient (R) of 0.366 and weighted average of 11.1%. Similarly, the statistical analysis conducted on geographies consisting of 539,215,088 people shows no correlation between the proportion of Dutch and poverty level among seniors over the age of 75 in the United States with a correlation coefficient (R) of 0.046 and weighted average of 10.5%, a difference of 5.6%.
Seniors Poverty Over the Age of 75 Correlation Summary
| Measurement | Hawaiian | Dutch |
| Minimum | 2.3% | 2.2% |
| Maximum | 24.1% | 25.2% |
| Range | 21.8% | 23.0% |
| Mean | 11.2% | 11.6% |
| Median | 10.3% | 10.5% |
| Interquartile 25% (IQ1) | 7.0% | 7.6% |
| Interquartile 75% (IQ3) | 14.5% | 15.7% |
| Interquartile Range (IQR) | 7.5% | 8.1% |
| Standard Deviation (Sample) | 5.5% | 5.4% |
| Standard Deviation (Population) | 5.4% | 5.4% |
Similar Demographics by Seniors Poverty Over the Age of 75
Demographics Similar to Hawaiians by Seniors Poverty Over the Age of 75
In terms of seniors poverty over the age of 75, the demographic groups most similar to Hawaiians are French (11.1%, a difference of 0.040%), Samoan (11.1%, a difference of 0.15%), Serbian (11.1%, a difference of 0.26%), Immigrants from North Macedonia (11.1%, a difference of 0.29%), and Greek (11.1%, a difference of 0.44%).
| Demographics | Rating | Rank | Seniors Poverty Over the Age of 75 |
| Thais | 99.4 /100 | #40 | Exceptional 10.9% |
| Immigrants | Lithuania | 99.2 /100 | #41 | Exceptional 11.0% |
| Austrians | 99.1 /100 | #42 | Exceptional 11.0% |
| Celtics | 99.1 /100 | #43 | Exceptional 11.0% |
| Belgians | 99.1 /100 | #44 | Exceptional 11.0% |
| Carpatho Rusyns | 99.0 /100 | #45 | Exceptional 11.1% |
| Greeks | 99.0 /100 | #46 | Exceptional 11.1% |
| Hawaiians | 98.8 /100 | #47 | Exceptional 11.1% |
| French | 98.7 /100 | #48 | Exceptional 11.1% |
| Samoans | 98.7 /100 | #49 | Exceptional 11.1% |
| Serbians | 98.6 /100 | #50 | Exceptional 11.1% |
| Immigrants | North Macedonia | 98.6 /100 | #51 | Exceptional 11.1% |
| Zimbabweans | 98.5 /100 | #52 | Exceptional 11.2% |
| Immigrants | England | 98.4 /100 | #53 | Exceptional 11.2% |
| Afghans | 98.2 /100 | #54 | Exceptional 11.2% |
Demographics Similar to Dutch by Seniors Poverty Over the Age of 75
In terms of seniors poverty over the age of 75, the demographic groups most similar to Dutch are Scottish (10.5%, a difference of 0.12%), European (10.5%, a difference of 0.12%), Slovak (10.5%, a difference of 0.21%), Welsh (10.5%, a difference of 0.21%), and Immigrants from Scotland (10.5%, a difference of 0.25%).
| Demographics | Rating | Rank | Seniors Poverty Over the Age of 75 |
| English | 99.9 /100 | #9 | Exceptional 10.4% |
| Scandinavians | 99.9 /100 | #10 | Exceptional 10.4% |
| Immigrants | India | 99.9 /100 | #11 | Exceptional 10.4% |
| Tongans | 99.9 /100 | #12 | Exceptional 10.5% |
| Croatians | 99.9 /100 | #13 | Exceptional 10.5% |
| Scottish | 99.9 /100 | #14 | Exceptional 10.5% |
| Europeans | 99.9 /100 | #15 | Exceptional 10.5% |
| Dutch | 99.9 /100 | #16 | Exceptional 10.5% |
| Slovaks | 99.9 /100 | #17 | Exceptional 10.5% |
| Welsh | 99.9 /100 | #18 | Exceptional 10.5% |
| Immigrants | Scotland | 99.9 /100 | #19 | Exceptional 10.5% |
| Czechs | 99.9 /100 | #20 | Exceptional 10.5% |
| Slovenes | 99.9 /100 | #21 | Exceptional 10.6% |
| Bhutanese | 99.8 /100 | #22 | Exceptional 10.6% |
| Lithuanians | 99.8 /100 | #23 | Exceptional 10.6% |