Haitian vs Hispanic or Latino Single Female Poverty
COMPARE
Haitian
Hispanic or Latino
Single Female Poverty
Single Female Poverty Comparison
Haitians
Hispanics or Latinos
21.6%
SINGLE FEMALE POVERTY
15.4/ 100
METRIC RATING
208th/ 347
METRIC RANK
24.6%
SINGLE FEMALE POVERTY
0.0/ 100
METRIC RATING
295th/ 347
METRIC RANK
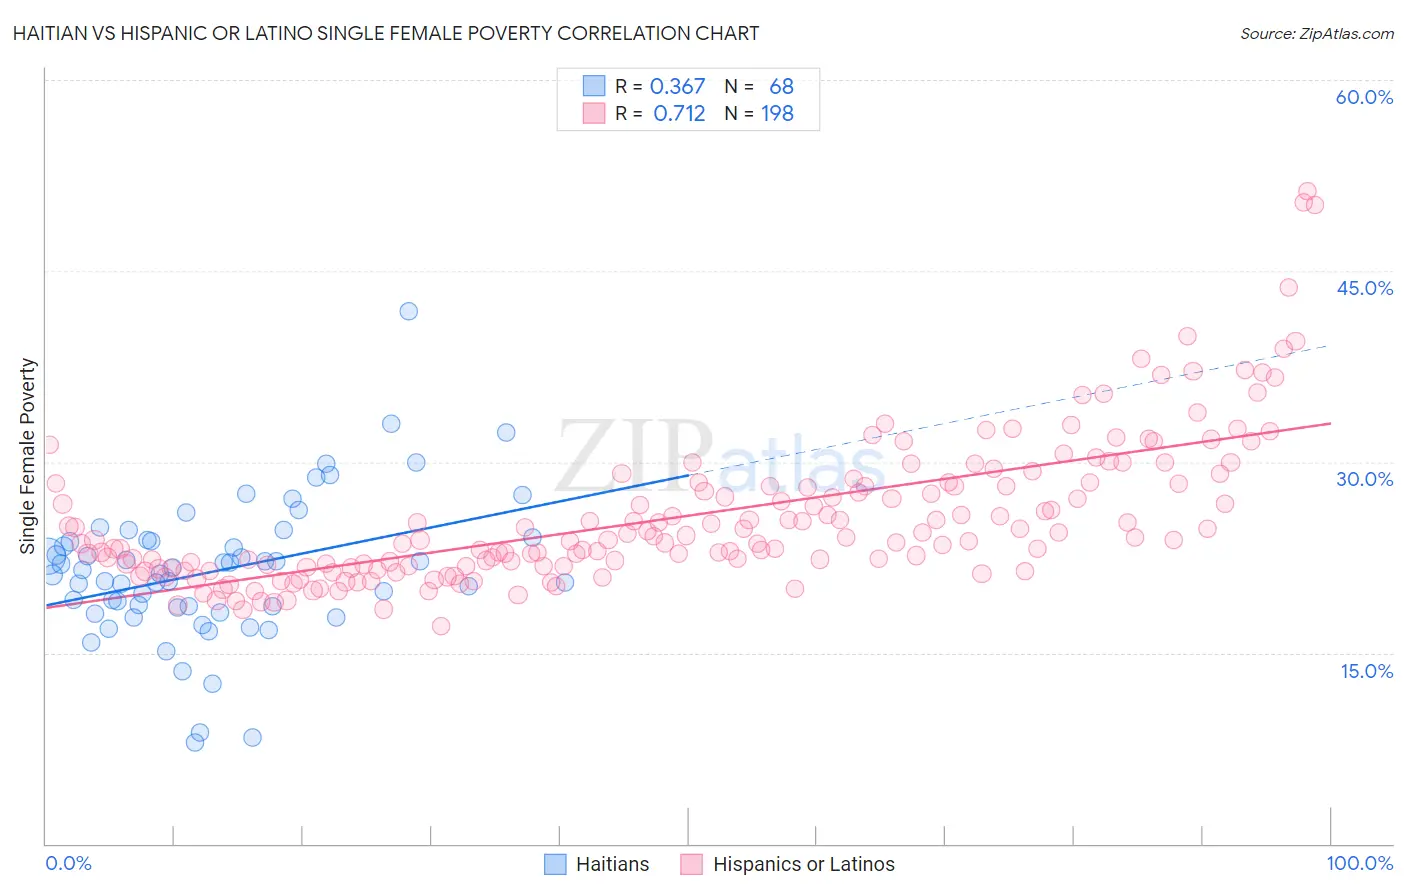
Haitian vs Hispanic or Latino Single Female Poverty Correlation Chart
The statistical analysis conducted on geographies consisting of 284,824,358 people shows a mild positive correlation between the proportion of Haitians and poverty level among single females in the United States with a correlation coefficient (R) of 0.367 and weighted average of 21.6%. Similarly, the statistical analysis conducted on geographies consisting of 554,629,261 people shows a strong positive correlation between the proportion of Hispanics or Latinos and poverty level among single females in the United States with a correlation coefficient (R) of 0.712 and weighted average of 24.6%, a difference of 14.2%.
Single Female Poverty Correlation Summary
| Measurement | Haitian | Hispanic or Latino |
| Minimum | 7.9% | 17.1% |
| Maximum | 41.8% | 51.2% |
| Range | 33.9% | 34.2% |
| Mean | 21.5% | 25.7% |
| Median | 21.3% | 23.9% |
| Interquartile 25% (IQ1) | 18.6% | 21.8% |
| Interquartile 75% (IQ3) | 23.8% | 28.3% |
| Interquartile Range (IQR) | 5.2% | 6.5% |
| Standard Deviation (Sample) | 5.6% | 5.8% |
| Standard Deviation (Population) | 5.5% | 5.8% |
Similar Demographics by Single Female Poverty
Demographics Similar to Haitians by Single Female Poverty
In terms of single female poverty, the demographic groups most similar to Haitians are Immigrants from Eastern Africa (21.6%, a difference of 0.030%), Ghanaian (21.6%, a difference of 0.040%), Belgian (21.5%, a difference of 0.070%), Finnish (21.5%, a difference of 0.090%), and Immigrants from Panama (21.6%, a difference of 0.12%).
| Demographics | Rating | Rank | Single Female Poverty |
| Nigerians | 20.9 /100 | #201 | Fair 21.4% |
| Immigrants | Kenya | 20.7 /100 | #202 | Fair 21.4% |
| Immigrants | Haiti | 18.8 /100 | #203 | Poor 21.5% |
| Immigrants | Africa | 16.7 /100 | #204 | Poor 21.5% |
| Finns | 16.2 /100 | #205 | Poor 21.5% |
| Belgians | 16.1 /100 | #206 | Poor 21.5% |
| Ghanaians | 15.7 /100 | #207 | Poor 21.6% |
| Haitians | 15.4 /100 | #208 | Poor 21.6% |
| Immigrants | Eastern Africa | 15.1 /100 | #209 | Poor 21.6% |
| Immigrants | Panama | 14.4 /100 | #210 | Poor 21.6% |
| Icelanders | 14.0 /100 | #211 | Poor 21.6% |
| Jamaicans | 14.0 /100 | #212 | Poor 21.6% |
| Guamanians/Chamorros | 13.7 /100 | #213 | Poor 21.6% |
| Immigrants | Nicaragua | 13.3 /100 | #214 | Poor 21.6% |
| Ecuadorians | 12.3 /100 | #215 | Poor 21.6% |
Demographics Similar to Hispanics or Latinos by Single Female Poverty
In terms of single female poverty, the demographic groups most similar to Hispanics or Latinos are French American Indian (24.6%, a difference of 0.35%), African (24.8%, a difference of 0.48%), American (24.5%, a difference of 0.49%), Alsatian (24.5%, a difference of 0.57%), and Immigrants from Central America (24.8%, a difference of 0.76%).
| Demographics | Rating | Rank | Single Female Poverty |
| Spanish Americans | 0.0 /100 | #288 | Tragic 24.2% |
| U.S. Virgin Islanders | 0.0 /100 | #289 | Tragic 24.2% |
| Indonesians | 0.0 /100 | #290 | Tragic 24.3% |
| Osage | 0.0 /100 | #291 | Tragic 24.4% |
| Alsatians | 0.0 /100 | #292 | Tragic 24.5% |
| Americans | 0.0 /100 | #293 | Tragic 24.5% |
| French American Indians | 0.0 /100 | #294 | Tragic 24.6% |
| Hispanics or Latinos | 0.0 /100 | #295 | Tragic 24.6% |
| Africans | 0.0 /100 | #296 | Tragic 24.8% |
| Immigrants | Central America | 0.0 /100 | #297 | Tragic 24.8% |
| Yaqui | 0.0 /100 | #298 | Tragic 24.9% |
| Mexicans | 0.0 /100 | #299 | Tragic 25.0% |
| Blackfeet | 0.0 /100 | #300 | Tragic 25.1% |
| Hondurans | 0.0 /100 | #301 | Tragic 25.1% |
| Shoshone | 0.0 /100 | #302 | Tragic 25.1% |