Guyanese vs Polish Seniors Poverty Over the Age of 75

COMPARE

Guyanese
Race
Ancestry
AfghanAfricanAlaska NativeAlaskan AthabascanAlbanianAleutAlsatianAmericanApacheArabArapahoArgentineanArmenianAssyrian/Chaldean/SyriacAustralianAustrianBahamianBangladeshiBarbadianBasqueBelgianBelizeanBermudanBhutaneseBlackfeetBolivianBrazilianBritishBritish West IndianBulgarianBurmeseCajunCambodianCanadianCape VerdeanCarpatho RusynCelticCentral AmericanCentral American IndianCherokeeCheyenneChickasawChileanChineseChippewaChoctawColombianColvilleComancheCosta RicanCreeCreekCroatianCrowCubanCypriotCzechCzechoslovakianDanishDelawareDominicanDutchDutch West IndianEastern EuropeanEcuadorianEgyptianEnglishEstonianEthiopianEuropeanFijianFilipinoFinnishFrenchFrench American IndianFrench CanadianGermanGerman RussianGhanaianGreekGuamanian/ChamorroGuatemalanGuyaneseHaitianHmongHonduranHopiHoumaHungarianIcelanderIndian (Asian)IndonesianInupiatIranianIraqiIrishIroquoisIsraeliItalianJamaicanJapaneseJordanianKenyanKiowaKoreanLaotianLatvianLebaneseLiberianLithuanianLumbeeLuxembourgerMacedonianMalaysianMalteseMarshalleseMenomineeMexicanMexican American IndianMongolianMoroccanNative HawaiianNavajoNepaleseNew ZealanderNicaraguanNigerianNorthern EuropeanNorwegianOkinawanOsageOttawaPaiutePakistaniPalestinianPanamanianParaguayanPennsylvania GermanPeruvianPimaPortuguesePotawatomiPuebloPuerto RicanPuget Sound SalishRomanianRussianSalvadoranSamoanScandinavianScotch-IrishScottishSeminoleSenegaleseSerbianShoshoneSierra LeoneanSiouxSlavicSlovakSloveneSomaliSouth AfricanSouth AmericanSouth American IndianSoviet UnionSpaniardSpanishSpanish AmericanSpanish American IndianSri LankanSubsaharan AfricanSudaneseSwedishSwissSyrianTaiwaneseThaiTlingit-HaidaTohono O'OdhamTonganTrinidadian and TobagonianTsimshianTurkishU.S. Virgin IslanderUgandanUkrainianUruguayanUteVenezuelanVietnameseWelshWest IndianYakamaYaquiYugoslavianYumanYup'ikZimbabwean
Immigration
NonimmigrantsImmigrantsAfghanistanAfricaAlbaniaArgentinaArmeniaAsiaAustraliaAustriaBahamasBangladeshBarbadosBelarusBelgiumBelizeBoliviaBosnia and HerzegovinaBrazilBulgariaBurma/MyanmarCabo VerdeCambodiaCameroonCanadaCaribbeanCentral AmericaChileChinaColombiaCongoCosta RicaCroatiaCubaCzechoslovakiaDenmarkDominicaDominican RepublicEastern AfricaEastern AsiaEastern EuropeEcuadorEgyptEl SalvadorEnglandEritreaEthiopiaEuropeFijiFranceGermanyGhanaGreeceGrenadaGuatemalaGuyanaHaitiHondurasHong KongHungaryIndiaIndonesiaIranIraqIrelandIsraelItalyJamaicaJapanJordanKazakhstanKenyaKoreaKuwaitLaosLatin AmericaLatviaLebanonLiberiaLithuaniaMalaysiaMexicoMicronesiaMiddle AfricaMoldovaMoroccoNepalNetherlandsNicaraguaNigeriaNorth AmericaNorth MacedoniaNorthern AfricaNorthern EuropeNorwayOceaniaPakistanPanamaPeruPhilippinesPolandPortugalRomaniaRussiaSaudi ArabiaScotlandSenegalSerbiaSierra LeoneSingaporeSomaliaSouth AfricaSouth AmericaSouth Central AsiaSouth Eastern AsiaSouthern EuropeSpainSri LankaSt. Vincent and the GrenadinesSudanSwedenSwitzerlandSyriaTaiwanThailandTrinidad and TobagoTurkeyUgandaUkraineUruguayUzbekistanVenezuelaVietnamWest IndiesWestern AfricaWestern AsiaWestern EuropeYemenZaireZimbabweAzores
Polish
Race
Ancestry
AfghanAfricanAlaska NativeAlaskan AthabascanAlbanianAleutAlsatianAmericanApacheArabArapahoArgentineanArmenianAssyrian/Chaldean/SyriacAustralianAustrianBahamianBangladeshiBarbadianBasqueBelgianBelizeanBermudanBhutaneseBlackfeetBolivianBrazilianBritishBritish West IndianBulgarianBurmeseCajunCambodianCanadianCape VerdeanCarpatho RusynCelticCentral AmericanCentral American IndianCherokeeCheyenneChickasawChileanChineseChippewaChoctawColombianColvilleComancheCosta RicanCreeCreekCroatianCrowCubanCypriotCzechCzechoslovakianDanishDelawareDominicanDutchDutch West IndianEastern EuropeanEcuadorianEgyptianEnglishEstonianEthiopianEuropeanFijianFilipinoFinnishFrenchFrench American IndianFrench CanadianGermanGerman RussianGhanaianGreekGuamanian/ChamorroGuatemalanHaitianHmongHonduranHopiHoumaHungarianIcelanderIndian (Asian)IndonesianInupiatIranianIraqiIrishIroquoisIsraeliItalianJamaicanJapaneseJordanianKenyanKiowaKoreanLaotianLatvianLebaneseLiberianLithuanianLumbeeLuxembourgerMacedonianMalaysianMalteseMarshalleseMenomineeMexicanMexican American IndianMongolianMoroccanNative HawaiianNavajoNepaleseNew ZealanderNicaraguanNigerianNorthern EuropeanNorwegianOkinawanOsageOttawaPaiutePakistaniPalestinianPanamanianParaguayanPennsylvania GermanPeruvianPimaPolishPortuguesePotawatomiPuebloPuerto RicanPuget Sound SalishRomanianRussianSalvadoranSamoanScandinavianScotch-IrishScottishSeminoleSenegaleseSerbianShoshoneSierra LeoneanSiouxSlavicSlovakSloveneSomaliSouth AfricanSouth AmericanSouth American IndianSoviet UnionSpaniardSpanishSpanish AmericanSpanish American IndianSri LankanSubsaharan AfricanSudaneseSwedishSwissSyrianTaiwaneseThaiTlingit-HaidaTohono O'OdhamTonganTrinidadian and TobagonianTsimshianTurkishU.S. Virgin IslanderUgandanUkrainianUruguayanUteVenezuelanVietnameseWelshWest IndianYakamaYaquiYugoslavianYumanYup'ikZimbabwean
Immigration
NonimmigrantsImmigrantsAfghanistanAfricaAlbaniaArgentinaArmeniaAsiaAustraliaAustriaBahamasBangladeshBarbadosBelarusBelgiumBelizeBoliviaBosnia and HerzegovinaBrazilBulgariaBurma/MyanmarCabo VerdeCambodiaCameroonCanadaCaribbeanCentral AmericaChileChinaColombiaCongoCosta RicaCroatiaCubaCzechoslovakiaDenmarkDominicaDominican RepublicEastern AfricaEastern AsiaEastern EuropeEcuadorEgyptEl SalvadorEnglandEritreaEthiopiaEuropeFijiFranceGermanyGhanaGreeceGrenadaGuatemalaGuyanaHaitiHondurasHong KongHungaryIndiaIndonesiaIranIraqIrelandIsraelItalyJamaicaJapanJordanKazakhstanKenyaKoreaKuwaitLaosLatin AmericaLatviaLebanonLiberiaLithuaniaMalaysiaMexicoMicronesiaMiddle AfricaMoldovaMoroccoNepalNetherlandsNicaraguaNigeriaNorth AmericaNorth MacedoniaNorthern AfricaNorthern EuropeNorwayOceaniaPakistanPanamaPeruPhilippinesPolandPortugalRomaniaRussiaSaudi ArabiaScotlandSenegalSerbiaSierra LeoneSingaporeSomaliaSouth AfricaSouth AmericaSouth Central AsiaSouth Eastern AsiaSouthern EuropeSpainSri LankaSt. Vincent and the GrenadinesSudanSwedenSwitzerlandSyriaTaiwanThailandTrinidad and TobagoTurkeyUgandaUkraineUruguayUzbekistanVenezuelaVietnamWest IndiesWestern AfricaWestern AsiaWestern EuropeYemenZaireZimbabweAzores
Seniors Poverty Over the Age of 75
Income
Poverty
Unemployment
Labor Participation
Family Structure
Vehicle Availability
Education Level
Disability

Seniors Poverty Over the Age of 75 Comparison

Guyanese

Poles

Tragic
Exceptional
16.1%
SENIORS POVERTY OVER THE AGE OF 75
0.0/ 100
METRIC RATING
315th/ 347
METRIC RANK
10.6%
SENIORS POVERTY OVER THE AGE OF 75
99.8/ 100
METRIC RATING
24th/ 347
METRIC RANK

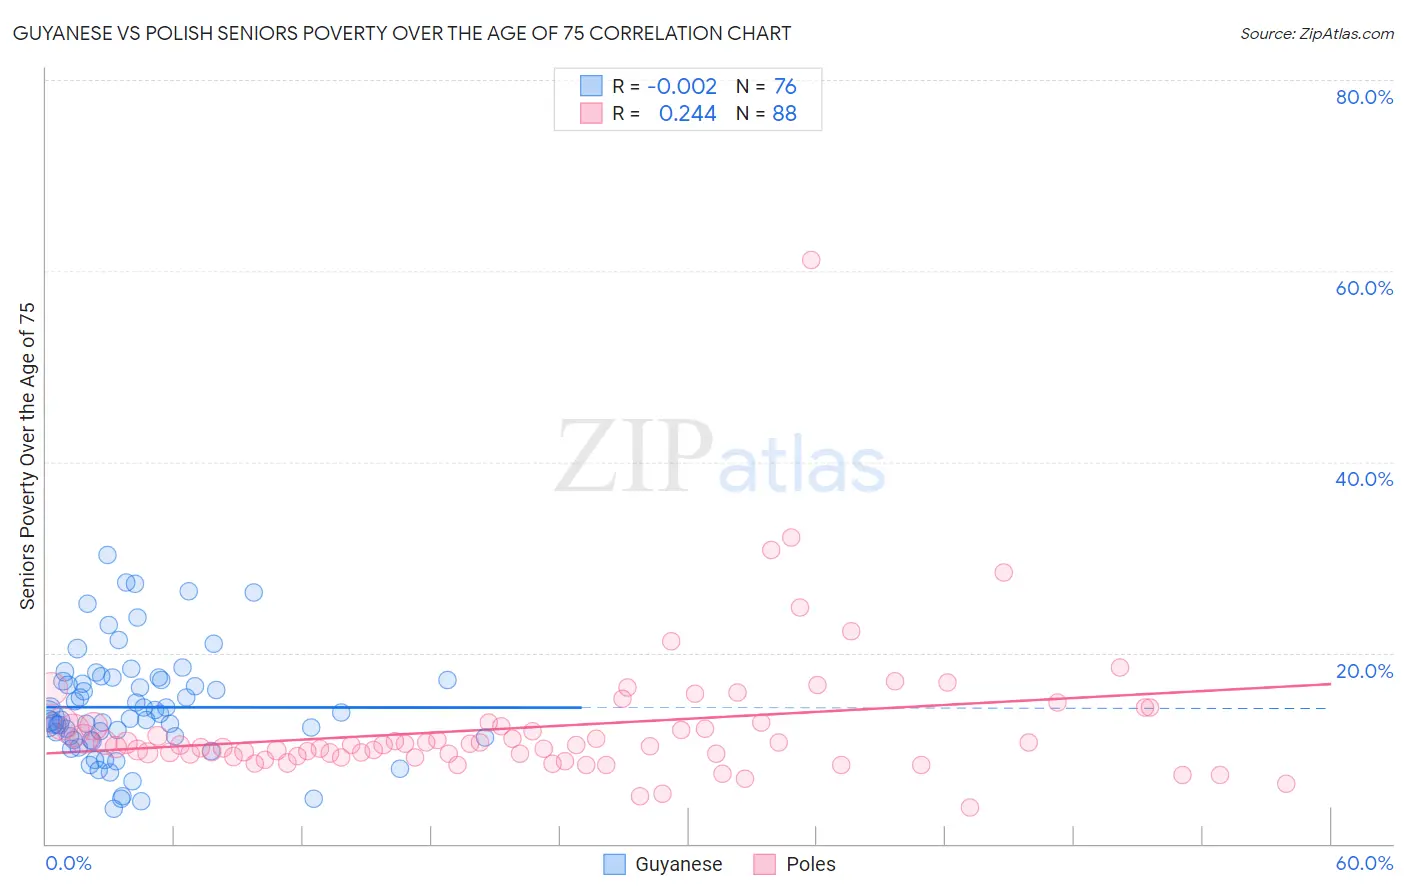
Guyanese vs Polish Seniors Poverty Over the Age of 75 Correlation Chart

The statistical analysis conducted on geographies consisting of 175,791,386 people shows no correlation between the proportion of Guyanese and poverty level among seniors over the age of 75 in the United States with a correlation coefficient (R) of -0.002 and weighted average of 16.1%. Similarly, the statistical analysis conducted on geographies consisting of 544,555,303 people shows a weak positive correlation between the proportion of Poles and poverty level among seniors over the age of 75 in the United States with a correlation coefficient (R) of 0.244 and weighted average of 10.6%, a difference of 52.2%.
Guyanese vs Polish Seniors Poverty Over the Age of 75

Seniors Poverty Over the Age of 75 Correlation Summary

MeasurementGuyanesePolish
Minimum3.7%3.8%
Maximum30.3%61.1%
Range26.6%57.3%
Mean14.3%12.3%
Median13.1%10.3%
Interquartile 25% (IQ1)11.0%9.3%
Interquartile 75% (IQ3)17.1%12.4%
Interquartile Range (IQR)6.1%3.2%
Standard Deviation (Sample)5.7%7.3%
Standard Deviation (Population)5.6%7.2%

Similar Demographics by Seniors Poverty Over the Age of 75

Demographics Similar to Guyanese by Seniors Poverty Over the Age of 75

In terms of seniors poverty over the age of 75, the demographic groups most similar to Guyanese are Immigrants from Ecuador (16.1%, a difference of 0.010%), Tsimshian (16.1%, a difference of 0.30%), Immigrants from Guyana (16.2%, a difference of 0.62%), Barbadian (16.0%, a difference of 0.66%), and Houma (16.2%, a difference of 0.75%).
DemographicsRating | RankSeniors Poverty Over the Age of 75
Immigrants | Bangladesh
0.0
/100
|
#308
Tragic
15.8%
Yup'ik
0.0
/100
|
#309
Tragic
15.8%
Vietnamese
0.0
/100
|
#310
Tragic
15.9%
Trinidadians and Tobagonians
0.0
/100
|
#311
Tragic
15.9%
Crow
0.0
/100
|
#312
Tragic
15.9%
Barbadians
0.0
/100
|
#313
Tragic
16.0%
Tsimshian
0.0
/100
|
#314
Tragic
16.1%
Guyanese
0.0
/100
|
#315
Tragic
16.1%
Immigrants | Ecuador
0.0
/100
|
#316
Tragic
16.1%
Immigrants | Guyana
0.0
/100
|
#317
Tragic
16.2%
Houma
0.0
/100
|
#318
Tragic
16.2%
Haitians
0.0
/100
|
#319
Tragic
16.2%
Immigrants | Yemen
0.0
/100
|
#320
Tragic
16.5%
Immigrants | Haiti
0.0
/100
|
#321
Tragic
16.5%
Immigrants | Barbados
0.0
/100
|
#322
Tragic
16.5%

Demographics Similar to Poles by Seniors Poverty Over the Age of 75

In terms of seniors poverty over the age of 75, the demographic groups most similar to Poles are Menominee (10.6%, a difference of 0.020%), Lithuanian (10.6%, a difference of 0.070%), Bhutanese (10.6%, a difference of 0.090%), Slovene (10.6%, a difference of 0.35%), and Czech (10.5%, a difference of 0.39%).
DemographicsRating | RankSeniors Poverty Over the Age of 75
Slovaks
99.9
/100
|
#17
Exceptional
10.5%
Welsh
99.9
/100
|
#18
Exceptional
10.5%
Immigrants | Scotland
99.9
/100
|
#19
Exceptional
10.5%
Czechs
99.9
/100
|
#20
Exceptional
10.5%
Slovenes
99.9
/100
|
#21
Exceptional
10.6%
Bhutanese
99.8
/100
|
#22
Exceptional
10.6%
Lithuanians
99.8
/100
|
#23
Exceptional
10.6%
Poles
99.8
/100
|
#24
Exceptional
10.6%
Menominee
99.8
/100
|
#25
Exceptional
10.6%
Bulgarians
99.8
/100
|
#26
Exceptional
10.7%
Northern Europeans
99.8
/100
|
#27
Exceptional
10.7%
Irish
99.8
/100
|
#28
Exceptional
10.7%
Assyrians/Chaldeans/Syriacs
99.8
/100
|
#29
Exceptional
10.7%
Swiss
99.7
/100
|
#30
Exceptional
10.7%
Marshallese
99.7
/100
|
#31
Exceptional
10.7%