Guatemalan vs Guamanian/Chamorro Male Poverty

COMPARE

Guatemalan
Race
Ancestry
AfghanAfricanAlaska NativeAlaskan AthabascanAlbanianAleutAlsatianAmericanApacheArabArapahoArgentineanArmenianAssyrian/Chaldean/SyriacAustralianAustrianBahamianBangladeshiBarbadianBasqueBelgianBelizeanBermudanBhutaneseBlackfeetBolivianBrazilianBritishBritish West IndianBulgarianBurmeseCajunCambodianCanadianCape VerdeanCarpatho RusynCelticCentral AmericanCentral American IndianCherokeeCheyenneChickasawChileanChineseChippewaChoctawColombianColvilleComancheCosta RicanCreeCreekCroatianCrowCubanCypriotCzechCzechoslovakianDanishDelawareDominicanDutchDutch West IndianEastern EuropeanEcuadorianEgyptianEnglishEstonianEthiopianEuropeanFijianFilipinoFinnishFrenchFrench American IndianFrench CanadianGermanGerman RussianGhanaianGreekGuatemalanGuyaneseHaitianHmongHonduranHopiHoumaHungarianIcelanderIndian (Asian)IndonesianInupiatIranianIraqiIrishIroquoisIsraeliItalianJamaicanJapaneseJordanianKenyanKiowaKoreanLaotianLatvianLebaneseLiberianLithuanianLumbeeLuxembourgerMacedonianMalaysianMalteseMarshalleseMenomineeMexicanMexican American IndianMongolianMoroccanNative HawaiianNavajoNepaleseNew ZealanderNicaraguanNigerianNorthern EuropeanNorwegianOkinawanOsageOttawaPaiutePakistaniPalestinianPanamanianParaguayanPennsylvania GermanPeruvianPimaPolishPortuguesePotawatomiPuebloPuerto RicanPuget Sound SalishRomanianRussianSalvadoranSamoanScandinavianScotch-IrishScottishSeminoleSenegaleseSerbianShoshoneSierra LeoneanSiouxSlavicSlovakSloveneSomaliSouth AfricanSouth AmericanSouth American IndianSoviet UnionSpaniardSpanishSpanish AmericanSpanish American IndianSri LankanSubsaharan AfricanSudaneseSwedishSwissSyrianTaiwaneseThaiTlingit-HaidaTohono O'OdhamTonganTrinidadian and TobagonianTsimshianTurkishU.S. Virgin IslanderUgandanUkrainianUruguayanUteVenezuelanVietnameseWelshWest IndianYakamaYaquiYugoslavianYumanYup'ikZimbabwean
Immigration
NonimmigrantsImmigrantsAfghanistanAfricaAlbaniaArgentinaArmeniaAsiaAustraliaAustriaBahamasBangladeshBarbadosBelarusBelgiumBelizeBoliviaBosnia and HerzegovinaBrazilBulgariaBurma/MyanmarCabo VerdeCambodiaCameroonCanadaCaribbeanCentral AmericaChileChinaColombiaCongoCosta RicaCroatiaCubaCzechoslovakiaDenmarkDominicaDominican RepublicEastern AfricaEastern AsiaEastern EuropeEcuadorEgyptEl SalvadorEnglandEritreaEthiopiaEuropeFijiFranceGermanyGhanaGreeceGrenadaGuatemalaGuyanaHaitiHondurasHong KongHungaryIndiaIndonesiaIranIraqIrelandIsraelItalyJamaicaJapanJordanKazakhstanKenyaKoreaKuwaitLaosLatin AmericaLatviaLebanonLiberiaLithuaniaMalaysiaMexicoMicronesiaMiddle AfricaMoldovaMoroccoNepalNetherlandsNicaraguaNigeriaNorth AmericaNorth MacedoniaNorthern AfricaNorthern EuropeNorwayOceaniaPakistanPanamaPeruPhilippinesPolandPortugalRomaniaRussiaSaudi ArabiaScotlandSenegalSerbiaSierra LeoneSingaporeSomaliaSouth AfricaSouth AmericaSouth Central AsiaSouth Eastern AsiaSouthern EuropeSpainSri LankaSt. Vincent and the GrenadinesSudanSwedenSwitzerlandSyriaTaiwanThailandTrinidad and TobagoTurkeyUgandaUkraineUruguayUzbekistanVenezuelaVietnamWest IndiesWestern AfricaWestern AsiaWestern EuropeYemenZaireZimbabweAzores
Guamanian/Chamorro
Race
Ancestry
AfghanAfricanAlaska NativeAlaskan AthabascanAlbanianAleutAlsatianAmericanApacheArabArapahoArgentineanArmenianAssyrian/Chaldean/SyriacAustralianAustrianBahamianBangladeshiBarbadianBasqueBelgianBelizeanBermudanBhutaneseBlackfeetBolivianBrazilianBritishBritish West IndianBulgarianBurmeseCajunCambodianCanadianCape VerdeanCarpatho RusynCelticCentral AmericanCentral American IndianCherokeeCheyenneChickasawChileanChineseChippewaChoctawColombianColvilleComancheCosta RicanCreeCreekCroatianCrowCubanCypriotCzechCzechoslovakianDanishDelawareDominicanDutchDutch West IndianEastern EuropeanEcuadorianEgyptianEnglishEstonianEthiopianEuropeanFijianFilipinoFinnishFrenchFrench American IndianFrench CanadianGermanGerman RussianGhanaianGreekGuamanian/ChamorroGuyaneseHaitianHmongHonduranHopiHoumaHungarianIcelanderIndian (Asian)IndonesianInupiatIranianIraqiIrishIroquoisIsraeliItalianJamaicanJapaneseJordanianKenyanKiowaKoreanLaotianLatvianLebaneseLiberianLithuanianLumbeeLuxembourgerMacedonianMalaysianMalteseMarshalleseMenomineeMexicanMexican American IndianMongolianMoroccanNative HawaiianNavajoNepaleseNew ZealanderNicaraguanNigerianNorthern EuropeanNorwegianOkinawanOsageOttawaPaiutePakistaniPalestinianPanamanianParaguayanPennsylvania GermanPeruvianPimaPolishPortuguesePotawatomiPuebloPuerto RicanPuget Sound SalishRomanianRussianSalvadoranSamoanScandinavianScotch-IrishScottishSeminoleSenegaleseSerbianShoshoneSierra LeoneanSiouxSlavicSlovakSloveneSomaliSouth AfricanSouth AmericanSouth American IndianSoviet UnionSpaniardSpanishSpanish AmericanSpanish American IndianSri LankanSubsaharan AfricanSudaneseSwedishSwissSyrianTaiwaneseThaiTlingit-HaidaTohono O'OdhamTonganTrinidadian and TobagonianTsimshianTurkishU.S. Virgin IslanderUgandanUkrainianUruguayanUteVenezuelanVietnameseWelshWest IndianYakamaYaquiYugoslavianYumanYup'ikZimbabwean
Immigration
NonimmigrantsImmigrantsAfghanistanAfricaAlbaniaArgentinaArmeniaAsiaAustraliaAustriaBahamasBangladeshBarbadosBelarusBelgiumBelizeBoliviaBosnia and HerzegovinaBrazilBulgariaBurma/MyanmarCabo VerdeCambodiaCameroonCanadaCaribbeanCentral AmericaChileChinaColombiaCongoCosta RicaCroatiaCubaCzechoslovakiaDenmarkDominicaDominican RepublicEastern AfricaEastern AsiaEastern EuropeEcuadorEgyptEl SalvadorEnglandEritreaEthiopiaEuropeFijiFranceGermanyGhanaGreeceGrenadaGuatemalaGuyanaHaitiHondurasHong KongHungaryIndiaIndonesiaIranIraqIrelandIsraelItalyJamaicaJapanJordanKazakhstanKenyaKoreaKuwaitLaosLatin AmericaLatviaLebanonLiberiaLithuaniaMalaysiaMexicoMicronesiaMiddle AfricaMoldovaMoroccoNepalNetherlandsNicaraguaNigeriaNorth AmericaNorth MacedoniaNorthern AfricaNorthern EuropeNorwayOceaniaPakistanPanamaPeruPhilippinesPolandPortugalRomaniaRussiaSaudi ArabiaScotlandSenegalSerbiaSierra LeoneSingaporeSomaliaSouth AfricaSouth AmericaSouth Central AsiaSouth Eastern AsiaSouthern EuropeSpainSri LankaSt. Vincent and the GrenadinesSudanSwedenSwitzerlandSyriaTaiwanThailandTrinidad and TobagoTurkeyUgandaUkraineUruguayUzbekistanVenezuelaVietnamWest IndiesWestern AfricaWestern AsiaWestern EuropeYemenZaireZimbabweAzores
Male Poverty
Income
Poverty
Unemployment
Labor Participation
Family Structure
Vehicle Availability
Education Level
Disability

Male Poverty Comparison

Guatemalans

Guamanians/Chamorros

Tragic
Good
13.8%
MALE POVERTY
0.0/ 100
METRIC RATING
289th/ 347
METRIC RANK
11.0%
MALE POVERTY
67.6/ 100
METRIC RATING
150th/ 347
METRIC RANK

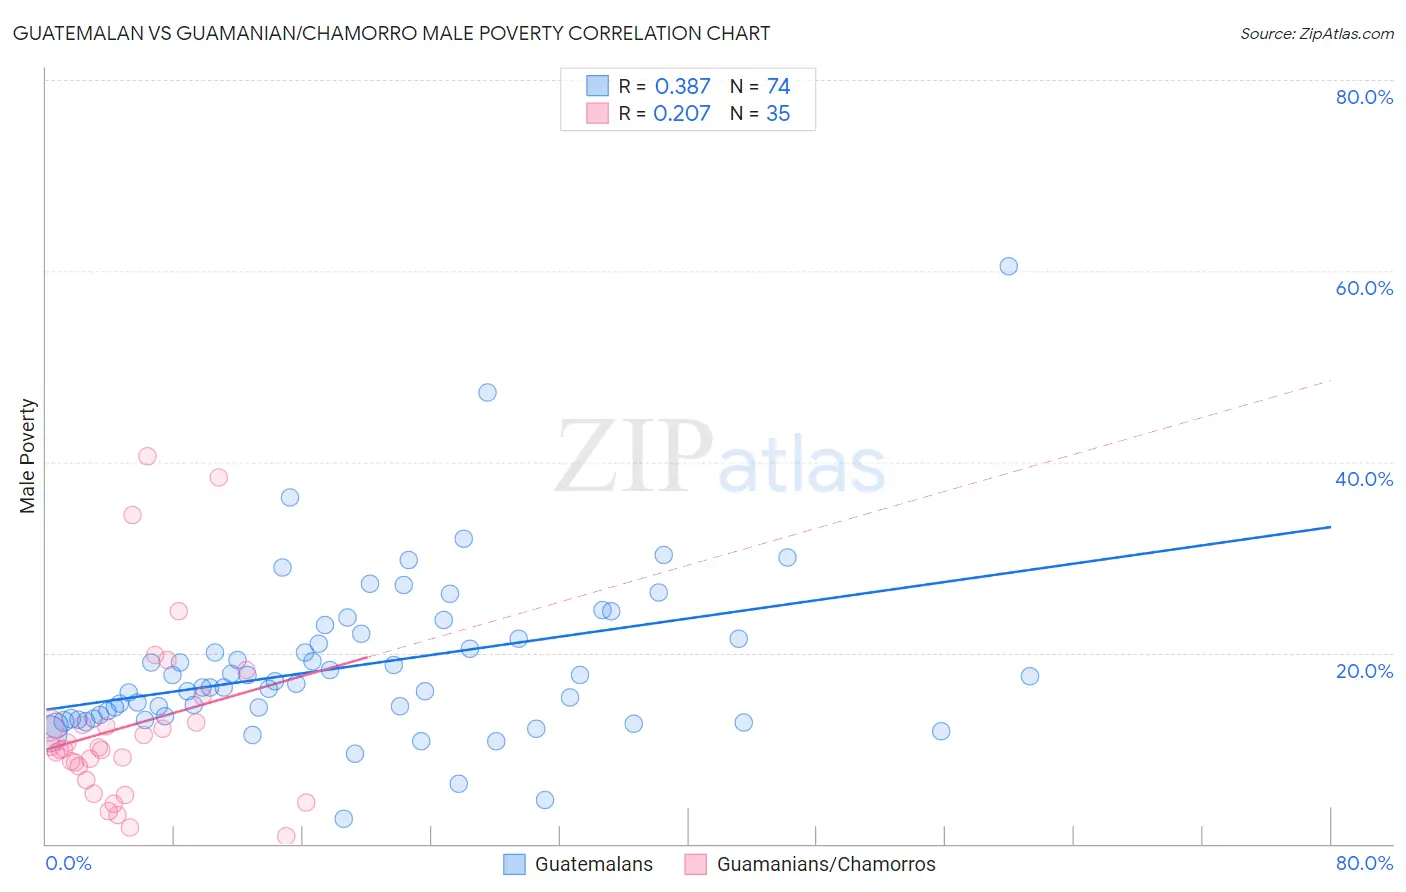
Guatemalan vs Guamanian/Chamorro Male Poverty Correlation Chart

The statistical analysis conducted on geographies consisting of 409,206,123 people shows a mild positive correlation between the proportion of Guatemalans and poverty level among males in the United States with a correlation coefficient (R) of 0.387 and weighted average of 13.8%. Similarly, the statistical analysis conducted on geographies consisting of 221,842,342 people shows a weak positive correlation between the proportion of Guamanians/Chamorros and poverty level among males in the United States with a correlation coefficient (R) of 0.207 and weighted average of 11.0%, a difference of 25.7%.
Guatemalan vs Guamanian/Chamorro Male Poverty

Male Poverty Correlation Summary

MeasurementGuatemalanGuamanian/Chamorro
Minimum2.7%0.76%
Maximum60.5%40.6%
Range57.9%39.9%
Mean18.7%12.3%
Median16.6%10.0%
Interquartile 25% (IQ1)13.1%6.6%
Interquartile 75% (IQ3)21.5%12.7%
Interquartile Range (IQR)8.4%6.1%
Standard Deviation (Sample)8.7%9.5%
Standard Deviation (Population)8.7%9.3%

Similar Demographics by Male Poverty

Demographics Similar to Guatemalans by Male Poverty

In terms of male poverty, the demographic groups most similar to Guatemalans are Immigrants from Zaire (13.8%, a difference of 0.010%), Vietnamese (13.8%, a difference of 0.10%), Immigrants from St. Vincent and the Grenadines (13.8%, a difference of 0.17%), Indonesian (13.8%, a difference of 0.26%), and Immigrants from Belize (13.8%, a difference of 0.27%).
DemographicsRating | RankMale Poverty
Immigrants | Cabo Verde
0.0
/100
|
#282
Tragic
13.7%
Comanche
0.0
/100
|
#283
Tragic
13.8%
Immigrants | Haiti
0.0
/100
|
#284
Tragic
13.8%
West Indians
0.0
/100
|
#285
Tragic
13.8%
Shoshone
0.0
/100
|
#286
Tragic
13.8%
Immigrants | Barbados
0.0
/100
|
#287
Tragic
13.8%
Immigrants | St. Vincent and the Grenadines
0.0
/100
|
#288
Tragic
13.8%
Guatemalans
0.0
/100
|
#289
Tragic
13.8%
Immigrants | Zaire
0.0
/100
|
#290
Tragic
13.8%
Vietnamese
0.0
/100
|
#291
Tragic
13.8%
Indonesians
0.0
/100
|
#292
Tragic
13.8%
Immigrants | Belize
0.0
/100
|
#293
Tragic
13.8%
Hispanics or Latinos
0.0
/100
|
#294
Tragic
13.9%
Immigrants | Central America
0.0
/100
|
#295
Tragic
13.9%
Cajuns
0.0
/100
|
#296
Tragic
13.9%

Demographics Similar to Guamanians/Chamorros by Male Poverty

In terms of male poverty, the demographic groups most similar to Guamanians/Chamorros are Venezuelan (11.0%, a difference of 0.020%), Immigrants from Nepal (11.0%, a difference of 0.030%), Immigrants from Venezuela (11.0%, a difference of 0.040%), Armenian (11.0%, a difference of 0.050%), and Icelander (11.0%, a difference of 0.11%).
DemographicsRating | RankMale Poverty
Afghans
71.9
/100
|
#143
Good
10.9%
Samoans
71.8
/100
|
#144
Good
10.9%
Immigrants | Germany
71.6
/100
|
#145
Good
10.9%
Syrians
71.4
/100
|
#146
Good
10.9%
Icelanders
68.5
/100
|
#147
Good
11.0%
Armenians
68.0
/100
|
#148
Good
11.0%
Immigrants | Venezuela
67.9
/100
|
#149
Good
11.0%
Guamanians/Chamorros
67.6
/100
|
#150
Good
11.0%
Venezuelans
67.4
/100
|
#151
Good
11.0%
Immigrants | Nepal
67.3
/100
|
#152
Good
11.0%
Immigrants | Bosnia and Herzegovina
65.2
/100
|
#153
Good
11.0%
Immigrants | Kazakhstan
64.8
/100
|
#154
Good
11.0%
Immigrants | Malaysia
64.7
/100
|
#155
Good
11.0%
Costa Ricans
63.9
/100
|
#156
Good
11.0%
Scotch-Irish
63.7
/100
|
#157
Good
11.0%