Ghanaian vs Immigrants from Eastern Europe Single Male Poverty

COMPARE

Ghanaian
Race
Ancestry
AfghanAfricanAlaska NativeAlaskan AthabascanAlbanianAleutAlsatianAmericanApacheArabArapahoArgentineanArmenianAssyrian/Chaldean/SyriacAustralianAustrianBahamianBangladeshiBarbadianBasqueBelgianBelizeanBermudanBhutaneseBlackfeetBolivianBrazilianBritishBritish West IndianBulgarianBurmeseCajunCambodianCanadianCape VerdeanCarpatho RusynCelticCentral AmericanCentral American IndianCherokeeCheyenneChickasawChileanChineseChippewaChoctawColombianColvilleComancheCosta RicanCreeCreekCroatianCrowCubanCypriotCzechCzechoslovakianDanishDelawareDominicanDutchDutch West IndianEastern EuropeanEcuadorianEgyptianEnglishEstonianEthiopianEuropeanFijianFilipinoFinnishFrenchFrench American IndianFrench CanadianGermanGerman RussianGhanaianGreekGuamanian/ChamorroGuatemalanGuyaneseHaitianHmongHonduranHopiHoumaHungarianIcelanderIndian (Asian)IndonesianInupiatIranianIraqiIrishIroquoisIsraeliItalianJamaicanJapaneseJordanianKenyanKiowaKoreanLaotianLatvianLebaneseLiberianLithuanianLumbeeLuxembourgerMacedonianMalaysianMalteseMarshalleseMenomineeMexicanMexican American IndianMongolianMoroccanNative HawaiianNavajoNepaleseNew ZealanderNicaraguanNigerianNorthern EuropeanNorwegianOkinawanOsageOttawaPaiutePakistaniPalestinianPanamanianParaguayanPennsylvania GermanPeruvianPimaPolishPortuguesePotawatomiPuebloPuerto RicanPuget Sound SalishRomanianRussianSalvadoranSamoanScandinavianScotch-IrishScottishSeminoleSenegaleseSerbianShoshoneSierra LeoneanSiouxSlavicSlovakSloveneSomaliSouth AfricanSouth AmericanSouth American IndianSoviet UnionSpaniardSpanishSpanish AmericanSpanish American IndianSri LankanSubsaharan AfricanSudaneseSwedishSwissSyrianTaiwaneseThaiTlingit-HaidaTohono O'OdhamTonganTrinidadian and TobagonianTsimshianTurkishU.S. Virgin IslanderUgandanUkrainianUruguayanUteVenezuelanVietnameseWelshWest IndianYakamaYaquiYugoslavianYumanYup'ikZimbabwean
Immigration
NonimmigrantsImmigrantsAfghanistanAfricaAlbaniaArgentinaArmeniaAsiaAustraliaAustriaBahamasBangladeshBarbadosBelarusBelgiumBelizeBoliviaBosnia and HerzegovinaBrazilBulgariaBurma/MyanmarCabo VerdeCambodiaCameroonCanadaCaribbeanCentral AmericaChileChinaColombiaCongoCosta RicaCroatiaCubaCzechoslovakiaDenmarkDominicaDominican RepublicEastern AfricaEastern AsiaEcuadorEgyptEl SalvadorEnglandEritreaEthiopiaEuropeFijiFranceGermanyGhanaGreeceGrenadaGuatemalaGuyanaHaitiHondurasHong KongHungaryIndiaIndonesiaIranIraqIrelandIsraelItalyJamaicaJapanJordanKazakhstanKenyaKoreaKuwaitLaosLatin AmericaLatviaLebanonLiberiaLithuaniaMalaysiaMexicoMicronesiaMiddle AfricaMoldovaMoroccoNepalNetherlandsNicaraguaNigeriaNorth AmericaNorth MacedoniaNorthern AfricaNorthern EuropeNorwayOceaniaPakistanPanamaPeruPhilippinesPolandPortugalRomaniaRussiaSaudi ArabiaScotlandSenegalSerbiaSierra LeoneSingaporeSomaliaSouth AfricaSouth AmericaSouth Central AsiaSouth Eastern AsiaSouthern EuropeSpainSri LankaSt. Vincent and the GrenadinesSudanSwedenSwitzerlandSyriaTaiwanThailandTrinidad and TobagoTurkeyUgandaUkraineUruguayUzbekistanVenezuelaVietnamWest IndiesWestern AfricaWestern AsiaWestern EuropeYemenZaireZimbabweAzores
Immigrants from Eastern Europe
Race
Ancestry
AfghanAfricanAlaska NativeAlaskan AthabascanAlbanianAleutAlsatianAmericanApacheArabArapahoArgentineanArmenianAssyrian/Chaldean/SyriacAustralianAustrianBahamianBangladeshiBarbadianBasqueBelgianBelizeanBermudanBhutaneseBlackfeetBolivianBrazilianBritishBritish West IndianBulgarianBurmeseCajunCambodianCanadianCape VerdeanCarpatho RusynCelticCentral AmericanCentral American IndianCherokeeCheyenneChickasawChileanChineseChippewaChoctawColombianColvilleComancheCosta RicanCreeCreekCroatianCrowCubanCypriotCzechCzechoslovakianDanishDelawareDominicanDutchDutch West IndianEastern EuropeanEcuadorianEgyptianEnglishEstonianEthiopianEuropeanFijianFilipinoFinnishFrenchFrench American IndianFrench CanadianGermanGerman RussianGreekGuamanian/ChamorroGuatemalanGuyaneseHaitianHmongHonduranHopiHoumaHungarianIcelanderIndian (Asian)IndonesianInupiatIranianIraqiIrishIroquoisIsraeliItalianJamaicanJapaneseJordanianKenyanKiowaKoreanLaotianLatvianLebaneseLiberianLithuanianLumbeeLuxembourgerMacedonianMalaysianMalteseMarshalleseMenomineeMexicanMexican American IndianMongolianMoroccanNative HawaiianNavajoNepaleseNew ZealanderNicaraguanNigerianNorthern EuropeanNorwegianOkinawanOsageOttawaPaiutePakistaniPalestinianPanamanianParaguayanPennsylvania GermanPeruvianPimaPolishPortuguesePotawatomiPuebloPuerto RicanPuget Sound SalishRomanianRussianSalvadoranSamoanScandinavianScotch-IrishScottishSeminoleSenegaleseSerbianShoshoneSierra LeoneanSiouxSlavicSlovakSloveneSomaliSouth AfricanSouth AmericanSouth American IndianSoviet UnionSpaniardSpanishSpanish AmericanSpanish American IndianSri LankanSubsaharan AfricanSudaneseSwedishSwissSyrianTaiwaneseThaiTlingit-HaidaTohono O'OdhamTonganTrinidadian and TobagonianTsimshianTurkishU.S. Virgin IslanderUgandanUkrainianUruguayanUteVenezuelanVietnameseWelshWest IndianYakamaYaquiYugoslavianYumanYup'ikZimbabwean
Immigration
NonimmigrantsImmigrantsAfghanistanAfricaAlbaniaArgentinaArmeniaAsiaAustraliaAustriaBahamasBangladeshBarbadosBelarusBelgiumBelizeBoliviaBosnia and HerzegovinaBrazilBulgariaBurma/MyanmarCabo VerdeCambodiaCameroonCanadaCaribbeanCentral AmericaChileChinaColombiaCongoCosta RicaCroatiaCubaCzechoslovakiaDenmarkDominicaDominican RepublicEastern AfricaEastern AsiaEastern EuropeEcuadorEgyptEl SalvadorEnglandEritreaEthiopiaEuropeFijiFranceGermanyGhanaGreeceGrenadaGuatemalaGuyanaHaitiHondurasHong KongHungaryIndiaIndonesiaIranIraqIrelandIsraelItalyJamaicaJapanJordanKazakhstanKenyaKoreaKuwaitLaosLatin AmericaLatviaLebanonLiberiaLithuaniaMalaysiaMexicoMicronesiaMiddle AfricaMoldovaMoroccoNepalNetherlandsNicaraguaNigeriaNorth AmericaNorth MacedoniaNorthern AfricaNorthern EuropeNorwayOceaniaPakistanPanamaPeruPhilippinesPolandPortugalRomaniaRussiaSaudi ArabiaScotlandSenegalSerbiaSierra LeoneSingaporeSomaliaSouth AfricaSouth AmericaSouth Central AsiaSouth Eastern AsiaSouthern EuropeSpainSri LankaSt. Vincent and the GrenadinesSudanSwedenSwitzerlandSyriaTaiwanThailandTrinidad and TobagoTurkeyUgandaUkraineUruguayUzbekistanVenezuelaVietnamWest IndiesWestern AfricaWestern AsiaWestern EuropeYemenZaireZimbabweAzores
Single Male Poverty
Income
Poverty
Unemployment
Labor Participation
Family Structure
Vehicle Availability
Education Level
Disability

Single Male Poverty Comparison

Ghanaians

Immigrants from Eastern Europe

Tragic
Exceptional
13.3%
SINGLE MALE POVERTY
6.1/ 100
METRIC RATING
230th/ 347
METRIC RANK
11.8%
SINGLE MALE POVERTY
99.6/ 100
METRIC RATING
64th/ 347
METRIC RANK

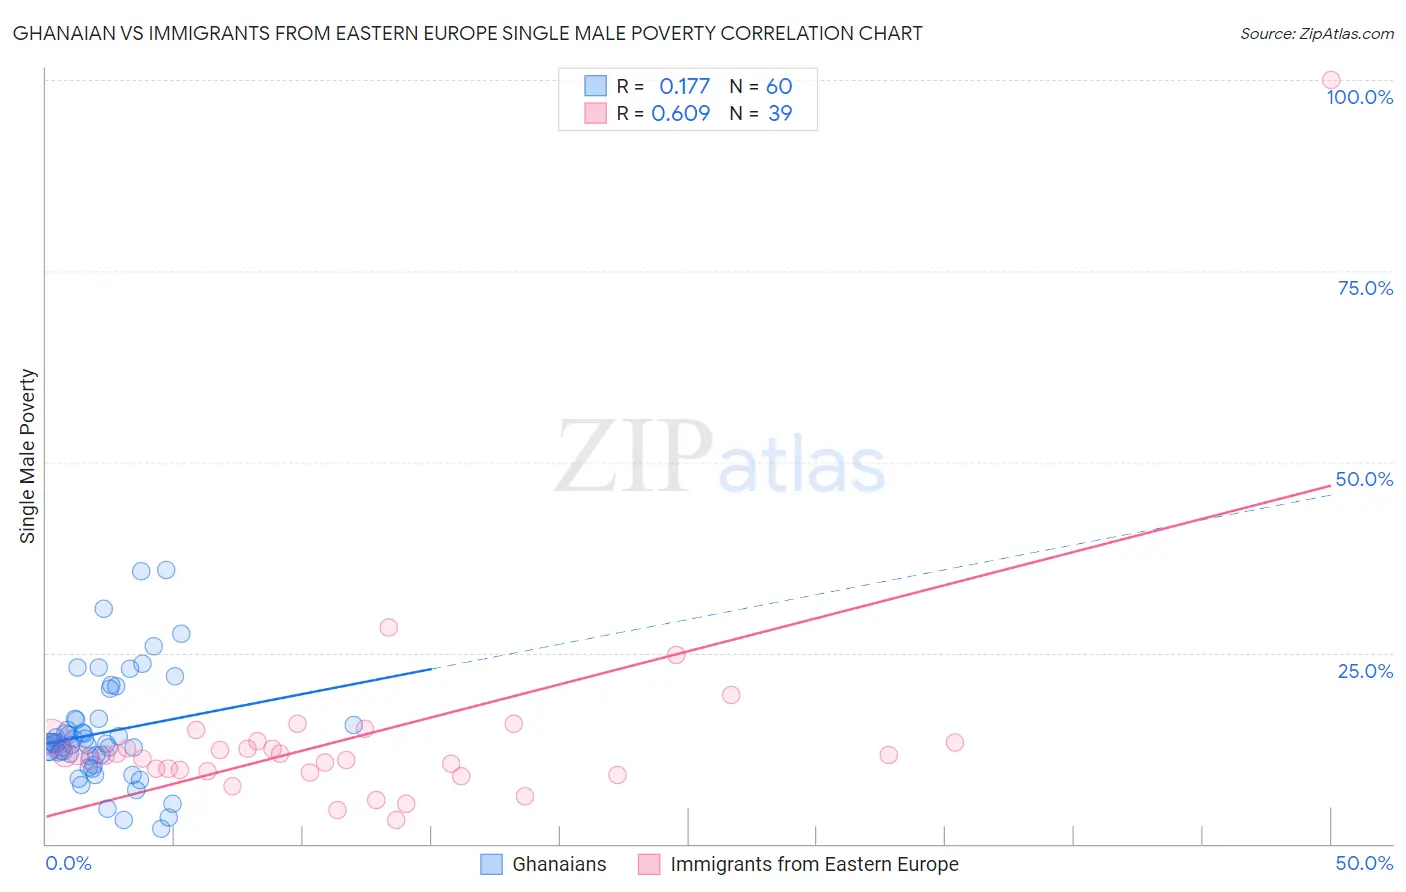
Ghanaian vs Immigrants from Eastern Europe Single Male Poverty Correlation Chart

The statistical analysis conducted on geographies consisting of 177,869,684 people shows a poor positive correlation between the proportion of Ghanaians and poverty level among single males in the United States with a correlation coefficient (R) of 0.177 and weighted average of 13.3%. Similarly, the statistical analysis conducted on geographies consisting of 407,915,677 people shows a significant positive correlation between the proportion of Immigrants from Eastern Europe and poverty level among single males in the United States with a correlation coefficient (R) of 0.609 and weighted average of 11.8%, a difference of 11.9%.
Ghanaian vs Immigrants from Eastern Europe Single Male Poverty

Single Male Poverty Correlation Summary

MeasurementGhanaianImmigrants from Eastern Europe
Minimum2.0%3.1%
Maximum35.8%100.0%
Range33.9%96.9%
Mean14.5%14.0%
Median13.1%11.6%
Interquartile 25% (IQ1)11.5%9.6%
Interquartile 75% (IQ3)16.3%13.3%
Interquartile Range (IQR)4.8%3.8%
Standard Deviation (Sample)7.0%14.9%
Standard Deviation (Population)7.0%14.7%

Similar Demographics by Single Male Poverty

Demographics Similar to Ghanaians by Single Male Poverty

In terms of single male poverty, the demographic groups most similar to Ghanaians are European (13.3%, a difference of 0.030%), Lebanese (13.2%, a difference of 0.12%), Slavic (13.3%, a difference of 0.18%), Haitian (13.2%, a difference of 0.20%), and Immigrants from Caribbean (13.3%, a difference of 0.27%).
DemographicsRating | RankSingle Male Poverty
Immigrants | Azores
9.3
/100
|
#223
Tragic
13.2%
Somalis
9.1
/100
|
#224
Tragic
13.2%
Immigrants | Denmark
8.7
/100
|
#225
Tragic
13.2%
Jamaicans
7.7
/100
|
#226
Tragic
13.2%
Haitians
7.0
/100
|
#227
Tragic
13.2%
Lebanese
6.6
/100
|
#228
Tragic
13.2%
Europeans
6.2
/100
|
#229
Tragic
13.3%
Ghanaians
6.1
/100
|
#230
Tragic
13.3%
Slavs
5.3
/100
|
#231
Tragic
13.3%
Immigrants | Caribbean
5.0
/100
|
#232
Tragic
13.3%
British
4.0
/100
|
#233
Tragic
13.3%
Canadians
4.0
/100
|
#234
Tragic
13.3%
Bangladeshis
3.7
/100
|
#235
Tragic
13.3%
Luxembourgers
3.6
/100
|
#236
Tragic
13.4%
British West Indians
3.4
/100
|
#237
Tragic
13.4%

Demographics Similar to Immigrants from Eastern Europe by Single Male Poverty

In terms of single male poverty, the demographic groups most similar to Immigrants from Eastern Europe are Laotian (11.9%, a difference of 0.10%), Immigrants from Uruguay (11.9%, a difference of 0.10%), Immigrants from Ukraine (11.9%, a difference of 0.12%), Immigrants from Croatia (11.9%, a difference of 0.13%), and Immigrants from Belarus (11.8%, a difference of 0.14%).
DemographicsRating | RankSingle Male Poverty
Immigrants | Romania
99.8
/100
|
#57
Exceptional
11.7%
Immigrants | Brazil
99.8
/100
|
#58
Exceptional
11.7%
Brazilians
99.8
/100
|
#59
Exceptional
11.8%
Peruvians
99.8
/100
|
#60
Exceptional
11.8%
Cambodians
99.8
/100
|
#61
Exceptional
11.8%
Immigrants | Sri Lanka
99.7
/100
|
#62
Exceptional
11.8%
Immigrants | Belarus
99.7
/100
|
#63
Exceptional
11.8%
Immigrants | Eastern Europe
99.6
/100
|
#64
Exceptional
11.8%
Laotians
99.6
/100
|
#65
Exceptional
11.9%
Immigrants | Uruguay
99.6
/100
|
#66
Exceptional
11.9%
Immigrants | Ukraine
99.6
/100
|
#67
Exceptional
11.9%
Immigrants | Croatia
99.6
/100
|
#68
Exceptional
11.9%
Immigrants | Russia
99.6
/100
|
#69
Exceptional
11.9%
Immigrants | Nepal
99.6
/100
|
#70
Exceptional
11.9%
Immigrants | Greece
99.6
/100
|
#71
Exceptional
11.9%