French Canadian vs Slavic Child Poverty Under the Age of 16

COMPARE

French Canadian
Race
Ancestry
AfghanAfricanAlaska NativeAlaskan AthabascanAlbanianAleutAlsatianAmericanApacheArabArapahoArgentineanArmenianAssyrian/Chaldean/SyriacAustralianAustrianBahamianBangladeshiBarbadianBasqueBelgianBelizeanBermudanBhutaneseBlackfeetBolivianBrazilianBritishBritish West IndianBulgarianBurmeseCajunCambodianCanadianCape VerdeanCarpatho RusynCelticCentral AmericanCentral American IndianCherokeeCheyenneChickasawChileanChineseChippewaChoctawColombianColvilleComancheCosta RicanCreeCreekCroatianCrowCubanCypriotCzechCzechoslovakianDanishDelawareDominicanDutchDutch West IndianEastern EuropeanEcuadorianEgyptianEnglishEstonianEthiopianEuropeanFijianFilipinoFinnishFrenchFrench American IndianFrench CanadianGermanGerman RussianGhanaianGreekGuamanian/ChamorroGuatemalanGuyaneseHaitianHmongHonduranHopiHoumaHungarianIcelanderIndian (Asian)IndonesianInupiatIranianIraqiIrishIroquoisIsraeliItalianJamaicanJapaneseJordanianKenyanKiowaKoreanLaotianLatvianLebaneseLiberianLithuanianLumbeeLuxembourgerMacedonianMalaysianMalteseMarshalleseMenomineeMexicanMexican American IndianMongolianMoroccanNative HawaiianNavajoNepaleseNew ZealanderNicaraguanNigerianNorthern EuropeanNorwegianOkinawanOsageOttawaPaiutePakistaniPalestinianPanamanianParaguayanPennsylvania GermanPeruvianPimaPolishPortuguesePotawatomiPuebloPuerto RicanPuget Sound SalishRomanianRussianSalvadoranSamoanScandinavianScotch-IrishScottishSeminoleSenegaleseSerbianShoshoneSierra LeoneanSiouxSlovakSloveneSomaliSouth AfricanSouth AmericanSouth American IndianSoviet UnionSpaniardSpanishSpanish AmericanSpanish American IndianSri LankanSubsaharan AfricanSudaneseSwedishSwissSyrianTaiwaneseThaiTlingit-HaidaTohono O'OdhamTonganTrinidadian and TobagonianTsimshianTurkishU.S. Virgin IslanderUgandanUkrainianUruguayanUteVenezuelanVietnameseWelshWest IndianYakamaYaquiYugoslavianYumanYup'ikZimbabwean
Immigration
NonimmigrantsImmigrantsAfghanistanAfricaAlbaniaArgentinaArmeniaAsiaAustraliaAustriaBahamasBangladeshBarbadosBelarusBelgiumBelizeBoliviaBosnia and HerzegovinaBrazilBulgariaBurma/MyanmarCabo VerdeCambodiaCameroonCanadaCaribbeanCentral AmericaChileChinaColombiaCongoCosta RicaCroatiaCubaCzechoslovakiaDenmarkDominicaDominican RepublicEastern AfricaEastern AsiaEastern EuropeEcuadorEgyptEl SalvadorEnglandEritreaEthiopiaEuropeFijiFranceGermanyGhanaGreeceGrenadaGuatemalaGuyanaHaitiHondurasHong KongHungaryIndiaIndonesiaIranIraqIrelandIsraelItalyJamaicaJapanJordanKazakhstanKenyaKoreaKuwaitLaosLatin AmericaLatviaLebanonLiberiaLithuaniaMalaysiaMexicoMicronesiaMiddle AfricaMoldovaMoroccoNepalNetherlandsNicaraguaNigeriaNorth AmericaNorth MacedoniaNorthern AfricaNorthern EuropeNorwayOceaniaPakistanPanamaPeruPhilippinesPolandPortugalRomaniaRussiaSaudi ArabiaScotlandSenegalSerbiaSierra LeoneSingaporeSomaliaSouth AfricaSouth AmericaSouth Central AsiaSouth Eastern AsiaSouthern EuropeSpainSri LankaSt. Vincent and the GrenadinesSudanSwedenSwitzerlandSyriaTaiwanThailandTrinidad and TobagoTurkeyUgandaUkraineUruguayUzbekistanVenezuelaVietnamWest IndiesWestern AfricaWestern AsiaWestern EuropeYemenZaireZimbabweAzores
Slavic
Race
Ancestry
AfghanAfricanAlaska NativeAlaskan AthabascanAlbanianAleutAlsatianAmericanApacheArabArapahoArgentineanArmenianAssyrian/Chaldean/SyriacAustralianAustrianBahamianBangladeshiBarbadianBasqueBelgianBelizeanBermudanBhutaneseBlackfeetBolivianBrazilianBritishBritish West IndianBulgarianBurmeseCajunCambodianCanadianCape VerdeanCarpatho RusynCelticCentral AmericanCentral American IndianCherokeeCheyenneChickasawChileanChineseChippewaChoctawColombianColvilleComancheCosta RicanCreeCreekCroatianCrowCubanCypriotCzechCzechoslovakianDanishDelawareDominicanDutchDutch West IndianEastern EuropeanEcuadorianEgyptianEnglishEstonianEthiopianEuropeanFijianFilipinoFinnishFrenchFrench American IndianGermanGerman RussianGhanaianGreekGuamanian/ChamorroGuatemalanGuyaneseHaitianHmongHonduranHopiHoumaHungarianIcelanderIndian (Asian)IndonesianInupiatIranianIraqiIrishIroquoisIsraeliItalianJamaicanJapaneseJordanianKenyanKiowaKoreanLaotianLatvianLebaneseLiberianLithuanianLumbeeLuxembourgerMacedonianMalaysianMalteseMarshalleseMenomineeMexicanMexican American IndianMongolianMoroccanNative HawaiianNavajoNepaleseNew ZealanderNicaraguanNigerianNorthern EuropeanNorwegianOkinawanOsageOttawaPaiutePakistaniPalestinianPanamanianParaguayanPennsylvania GermanPeruvianPimaPolishPortuguesePotawatomiPuebloPuerto RicanPuget Sound SalishRomanianRussianSalvadoranSamoanScandinavianScotch-IrishScottishSeminoleSenegaleseSerbianShoshoneSierra LeoneanSiouxSlavicSlovakSloveneSomaliSouth AfricanSouth AmericanSouth American IndianSoviet UnionSpaniardSpanishSpanish AmericanSpanish American IndianSri LankanSubsaharan AfricanSudaneseSwedishSwissSyrianTaiwaneseThaiTlingit-HaidaTohono O'OdhamTonganTrinidadian and TobagonianTsimshianTurkishU.S. Virgin IslanderUgandanUkrainianUruguayanUteVenezuelanVietnameseWelshWest IndianYakamaYaquiYugoslavianYumanYup'ikZimbabwean
Immigration
NonimmigrantsImmigrantsAfghanistanAfricaAlbaniaArgentinaArmeniaAsiaAustraliaAustriaBahamasBangladeshBarbadosBelarusBelgiumBelizeBoliviaBosnia and HerzegovinaBrazilBulgariaBurma/MyanmarCabo VerdeCambodiaCameroonCanadaCaribbeanCentral AmericaChileChinaColombiaCongoCosta RicaCroatiaCubaCzechoslovakiaDenmarkDominicaDominican RepublicEastern AfricaEastern AsiaEastern EuropeEcuadorEgyptEl SalvadorEnglandEritreaEthiopiaEuropeFijiFranceGermanyGhanaGreeceGrenadaGuatemalaGuyanaHaitiHondurasHong KongHungaryIndiaIndonesiaIranIraqIrelandIsraelItalyJamaicaJapanJordanKazakhstanKenyaKoreaKuwaitLaosLatin AmericaLatviaLebanonLiberiaLithuaniaMalaysiaMexicoMicronesiaMiddle AfricaMoldovaMoroccoNepalNetherlandsNicaraguaNigeriaNorth AmericaNorth MacedoniaNorthern AfricaNorthern EuropeNorwayOceaniaPakistanPanamaPeruPhilippinesPolandPortugalRomaniaRussiaSaudi ArabiaScotlandSenegalSerbiaSierra LeoneSingaporeSomaliaSouth AfricaSouth AmericaSouth Central AsiaSouth Eastern AsiaSouthern EuropeSpainSri LankaSt. Vincent and the GrenadinesSudanSwedenSwitzerlandSyriaTaiwanThailandTrinidad and TobagoTurkeyUgandaUkraineUruguayUzbekistanVenezuelaVietnamWest IndiesWestern AfricaWestern AsiaWestern EuropeYemenZaireZimbabweAzores
Child Poverty Under the Age of 16
Income
Poverty
Unemployment
Labor Participation
Family Structure
Vehicle Availability
Education Level
Disability

Child Poverty Under the Age of 16 Comparison

French Canadians

Slavs

Good
Excellent
15.6%
CHILD POVERTY UNDER THE AGE OF 16
78.2/ 100
METRIC RATING
152nd/ 347
METRIC RANK
15.4%
CHILD POVERTY UNDER THE AGE OF 16
84.2/ 100
METRIC RATING
141st/ 347
METRIC RANK

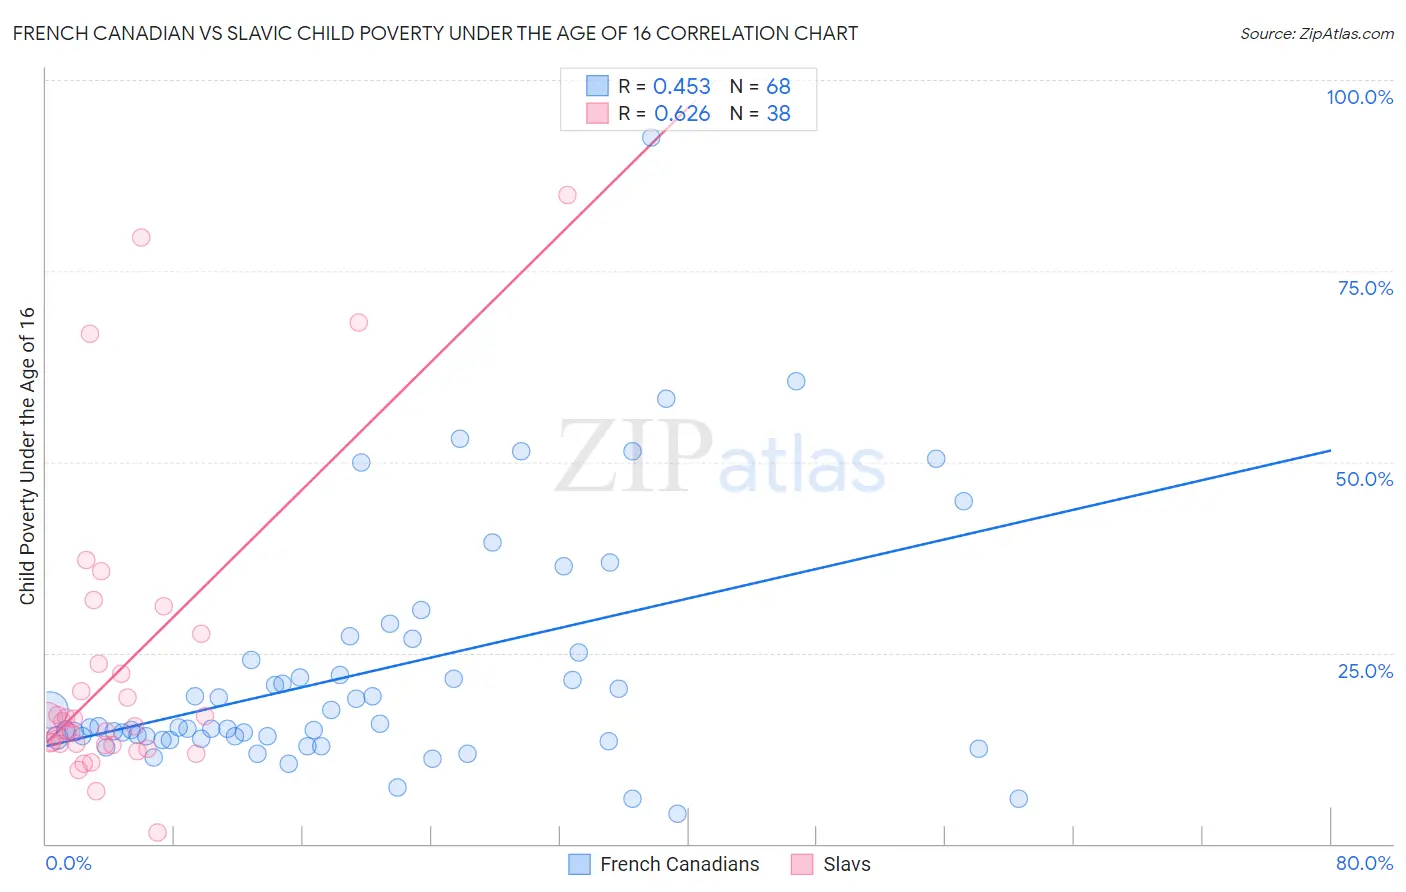
French Canadian vs Slavic Child Poverty Under the Age of 16 Correlation Chart

The statistical analysis conducted on geographies consisting of 494,388,455 people shows a moderate positive correlation between the proportion of French Canadians and poverty level among children under the age of 16 in the United States with a correlation coefficient (R) of 0.453 and weighted average of 15.6%. Similarly, the statistical analysis conducted on geographies consisting of 268,968,300 people shows a significant positive correlation between the proportion of Slavs and poverty level among children under the age of 16 in the United States with a correlation coefficient (R) of 0.626 and weighted average of 15.4%, a difference of 1.3%.
French Canadian vs Slavic Child Poverty Under the Age of 16

Child Poverty Under the Age of 16 Correlation Summary

MeasurementFrench CanadianSlavic
Minimum3.9%1.5%
Maximum92.5%85.0%
Range88.5%83.5%
Mean22.5%23.0%
Median15.3%15.7%
Interquartile 25% (IQ1)13.8%13.0%
Interquartile 75% (IQ3)24.5%23.5%
Interquartile Range (IQR)10.8%10.6%
Standard Deviation (Sample)15.9%19.7%
Standard Deviation (Population)15.8%19.4%

Demographics Similar to French Canadians and Slavs by Child Poverty Under the Age of 16

In terms of child poverty under the age of 16, the demographic groups most similar to French Canadians are Immigrants from Jordan (15.6%, a difference of 0.040%), French (15.6%, a difference of 0.040%), Venezuelan (15.6%, a difference of 0.15%), Samoan (15.6%, a difference of 0.18%), and Israeli (15.5%, a difference of 0.36%). Similarly, the demographic groups most similar to Slavs are Brazilian (15.4%, a difference of 0.34%), Icelander (15.4%, a difference of 0.41%), Immigrants from Hungary (15.5%, a difference of 0.53%), Immigrants from Peru (15.5%, a difference of 0.58%), and Slovak (15.5%, a difference of 0.62%).
DemographicsRating | RankChild Poverty Under the Age of 16
Immigrants | Spain
87.3
/100
|
#136
Excellent
15.3%
Peruvians
87.2
/100
|
#137
Excellent
15.3%
Welsh
87.2
/100
|
#138
Excellent
15.3%
Immigrants | Vietnam
87.1
/100
|
#139
Excellent
15.3%
New Zealanders
86.9
/100
|
#140
Excellent
15.3%
Slavs
84.2
/100
|
#141
Excellent
15.4%
Brazilians
82.8
/100
|
#142
Excellent
15.4%
Icelanders
82.5
/100
|
#143
Excellent
15.4%
Immigrants | Hungary
81.9
/100
|
#144
Excellent
15.5%
Immigrants | Peru
81.7
/100
|
#145
Excellent
15.5%
Slovaks
81.4
/100
|
#146
Excellent
15.5%
Immigrants | Kuwait
80.5
/100
|
#147
Excellent
15.5%
Puget Sound Salish
80.3
/100
|
#148
Excellent
15.5%
Israelis
80.1
/100
|
#149
Excellent
15.5%
Immigrants | Jordan
78.5
/100
|
#150
Good
15.6%
French
78.5
/100
|
#151
Good
15.6%
French Canadians
78.2
/100
|
#152
Good
15.6%
Venezuelans
77.4
/100
|
#153
Good
15.6%
Samoans
77.3
/100
|
#154
Good
15.6%
Syrians
76.1
/100
|
#155
Good
15.6%
Immigrants | Venezuela
74.9
/100
|
#156
Good
15.7%